
Income and Health, Neighborhood by Neighborhood: An Interactive Chart
A free, interactive chart of income and other economic measures against physical and mental health for about 78,000 U.S. census tracts and about 2,900 counties.

Eric Pachman
Published
November 20th 2026
Open the full visualization for the title and the full notes.
Purpose
On Wednesday, in Where JobsOhio's grant money landed in Ohio, we asked a question: should economic development and public health be planned together? We provided a first look at the data behind that question for Ohio's 3,115 census tracts, and we promised to take it national on Friday.
Today, we deliver on that promise.
On instinct, the link seems obvious. Places with more money tend to be healthier. But how close is the link, and does it hold all the way up the income ladder? Our theory going in was that health would track income closely in the poorest neighborhoods, up to a point, and that above that point the link would fade into scatter. Past a certain level, more money would stop going with better health.
The data only partly agreed. Health does improve fastest at the low end of income, and the gains slow down above about $110,000 in median household income. But they do not stop, and the dots do not scatter. In every state with enough neighborhoods to test, health keeps rising in the highest-income tracts, just more slowly. In short: steepest at the bottom, still rising at the top.
You do not have to take our word for it, though. The chart puts about 78,000 census tracts and about 2,900 counties in one place. Pick any of 15 economic measures and 18 health measures, look at the whole country or one state, and hover over any dot to see the neighborhood or county behind it.
Ultimately, here is the question we hope you take from this tool: if income and health move together this closely, it is fair to ask whether decisions about where jobs and investment go should be made with health in view. In other words, are economic development and improving public health part of the same initiative? That is the question we raised for Ohio. This chart lets anyone ask it of their own state.
Before you dig in, read the box below. The short version: the trend is the point, not any single dot.
Read this first
Look at the trend, not any single dot. Every number in this chart is an estimate. Income comes from a Census Bureau survey, and in a small tract its margin of error can be large. The health numbers are CDC model estimates, built partly from each area's age, sex, race, education and poverty, so part of the link between income and health is built into them. Within a county, differences between tracts come only from who lives there and from tract poverty, not from surveying each tract. So do not lean hard on the exact number for any one tract or county.
The overall link does not come from the model alone. We checked it against life expectancy for counties, which is counted from death records, not modeled. Income tracks it closely: split counties into 20 equal-size groups by income, and the middle county's life expectancy runs from 70.7 years in the lowest-income group to 80.8 years in the highest. Other researchers, using other data, have found the same link. A 2016 study in JAMA matched tax records to death records for millions of Americans and found that life expectancy rises with income at every income level (Chetty and others). A 2017 study found that county income, poverty, education, unemployment and racial and ethnic makeup together explain 60% of the differences in life expectancy between U.S. counties in 2009, and income alone explains 41% (Dwyer-Lindgren and others).
In our view, the trend strongly suggests a real connection between financial health and physical and mental health. The chart shows that connection. It does not show which way it runs or what causes it.
Using the visualization
1. Pick census tracts or counties. The Show menu at the top switches between about 78,000 census tracts and about 2,900 counties. A census tract is a neighborhood of about 4,000 people.
2. Pick an economic measure. The list on the left holds 15: median household income (the default), an economic index, income per person, the share of people at or above 200% of the poverty line, work, housing cost, public assistance and health insurance measures, and income inequality.
3. Pick a health measure. The list on the right holds 18 from CDC: a health index, physical health conditions such as obesity, diabetes and high blood pressure, mental health measures, behaviors such as smoking and short sleep, and three social needs such as food insecurity. In the county view, three more are counted from death records: life expectancy, drug overdose deaths and suicides.
4. Pick an area. The Area menu shows one state in blue against the rest of the country in gray. The rank correlation under the chart updates for that state.
5. Hover over or tap a dot. A box shows the tract or county, its state, and both values.
To share a view, add it to the page address. #county opens the county view, and &x= and &y= pick the measures. For example, #county&y=life_expectancy opens counties against life expectancy.
How to read it
- Each dot is one place. Income runs across the bottom; the health measure runs up the side.
- The orange line follows the middle of the cloud. It splits the places into 20 equal-size groups along the economic measure and joins each group's median values.
- The rank correlation under the chart runs from -1 to 1. Near 1, places that rank higher on the economic measure also rank higher on the health measure. Near 0, there is no pattern. It uses ranks, so a few extreme places do not swing it.
- The health index runs from 0 to 100, and higher is better. It averages each place's national rank on 14 health measures. The economic index works the same way for 12 economic measures.
- Some values are capped by the Census Bureau. It reports median household income above $250,000 only as "$250,000 or more." Those 541 tracts are not drawn, because they would all stack on one value, but they are counted in the rank correlation and the orange line. Median rent share shows as "50.0% or more" or "10.0% or less" at its limits.
What it shows right now
Across 77,708 census tracts with a published median household income, the rank correlation between income and the health index is 0.82. For the 12-measure economic index it is 0.71.
Health improves fastest at the low end of income, and it keeps improving at the top. Below about $110,000, the health index rises 0.66 points for each $1,000 of income. Above that, it rises 0.18 points, about 27% of the lower rate. The middle tract's diabetes rate falls from 20.2% in the lowest-income group of tracts (median income about $31,000) to 14.2% in a group with median income about $56,000, and to 8.6% in the highest-income group (about $197,000).
The same pattern holds in each state with enough tracts to test. Rank correlations run from 0.55 in North Dakota to 0.86 in New Jersey.
At the county level, income tracks life expectancy, which comes from death records rather than a model, at a rank correlation of 0.73. Drug overdose deaths (-0.25) and suicides (-0.31) follow county income much more loosely. For more on overdose deaths by county, see our map of fentanyl deaths by county.
The chart below shows that county check. Each dot is a county, and the line follows the middle county as income rises: from 70.7 years in the lowest-income group of counties to 80.8 years in the highest. It climbs fastest at the low end and keeps climbing at the top, the same shape as the health index. For counties, the slowdown comes at about $75,000 rather than $110,000: above it, life expectancy rises about 36% as fast. The bend sits lower because a county blends many neighborhoods, rich and poor, so county incomes bunch closer to the middle. No county in the chart tops about $182,000, while 2,841 tracts do.
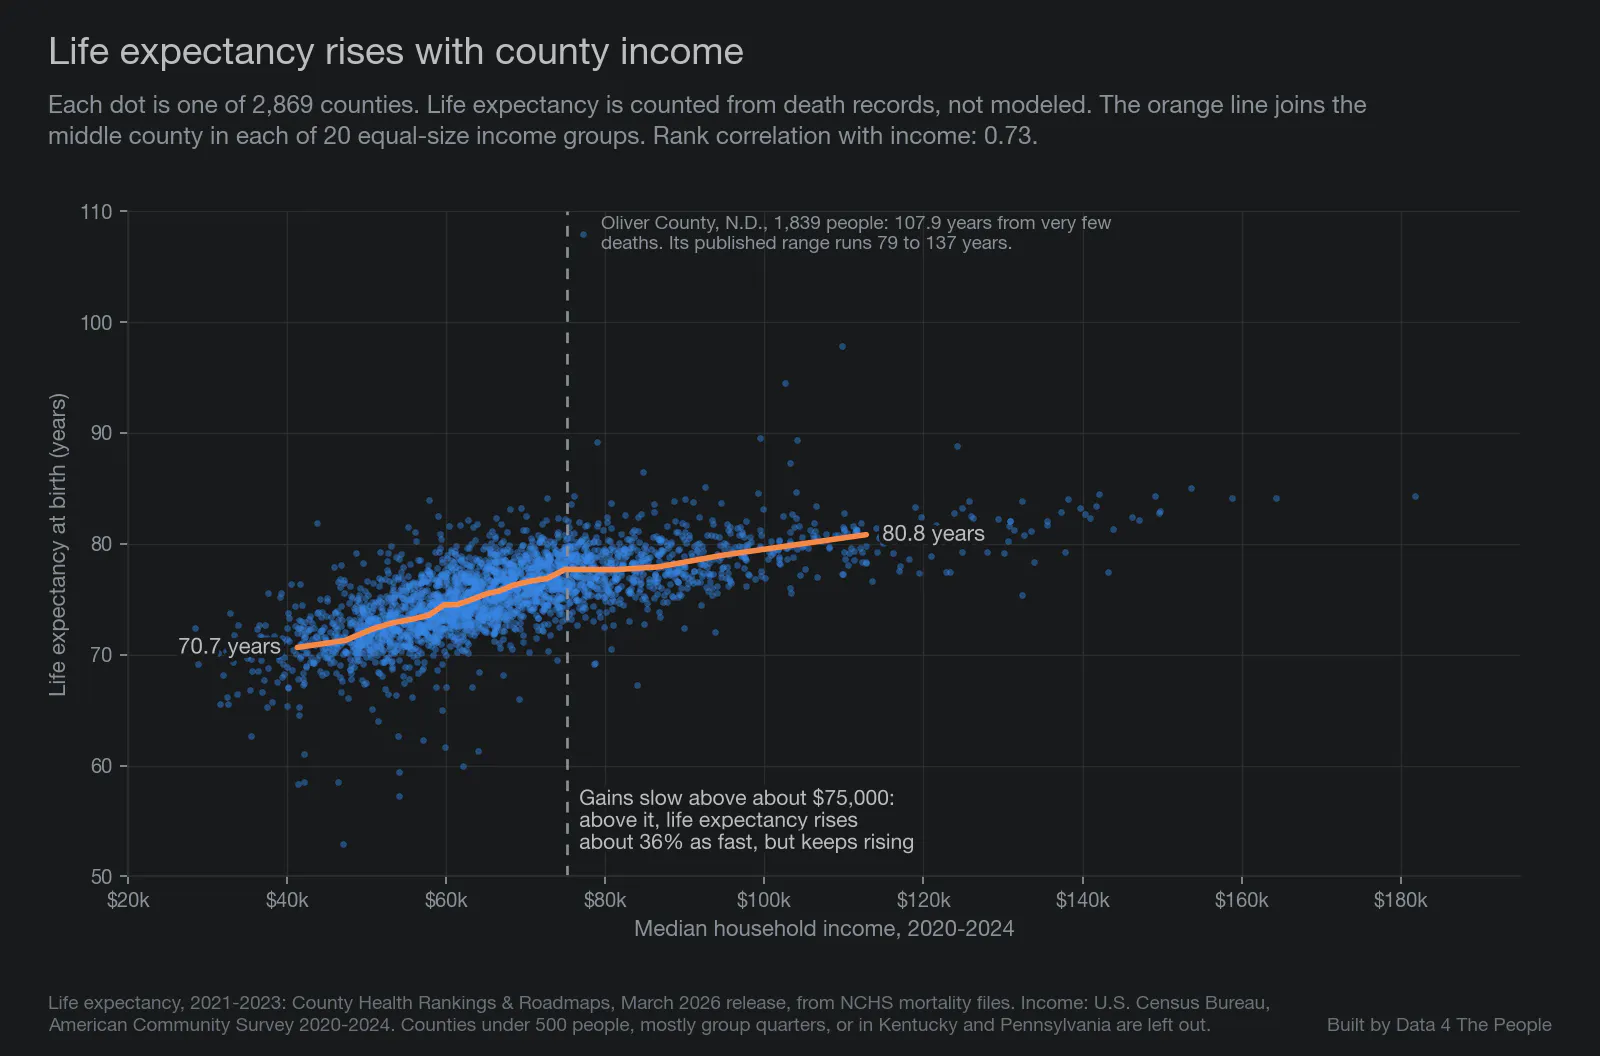
Life expectancy, 2021-2023: County Health Rankings & Roadmaps, March 2026 release. Income: U.S. Census Bureau, American Community Survey 2020-2024.
To see this in the chart above, switch Show to Counties and pick Life expectancy, or open that view directly.
What this page is
Every chart we publish should be something you can check, question and rebuild yourself. This page gives a short summary of how we built this one. The full documentation, with every source, definition and check, is in the public repository: DATASETS.md.
The data sources
American Community Survey, 2020-2024 five-year estimates, U.S. Census Bureau. Every economic measure, for census tracts and counties. Labor force change also uses the 2015-2019 estimates.
PLACES: Local Data for Better Health, 2025 release, CDC. Every physical and mental health measure, for census tracts and counties. Most are based on CDC's 2023 Behavioral Risk Factor Surveillance System survey. The chart is a free way to explore CDC PLACES census tract data alongside income.
County Health Rankings & Roadmaps, March 2026 release, University of Wisconsin Population Health Institute. Life expectancy (2021-2023), drug overdose deaths (2021-2023) and suicides (2019-2023), built from death records.
2020 census tract relationship file, U.S. Census Bureau. Used to match 2010 and 2020 tract boundaries for labor force change.
How we built it, in short
- We use each publisher's numbers as published. Nothing is filled in. When a source has no number, the place is left out of that chart.
- Some places are left out. Places with fewer than 500 people, or where half or more of residents live in group quarters such as prisons, dormitories or nursing homes, are left out. So are Kentucky and Pennsylvania (see below).
- The two indexes. Built step by step as described in the next section. Each index was set before we looked at the results, and we did not drop measures after seeing how they related to health.
- Counties are not averages of tracts. County values come straight from the county releases of each source.
- We check the numbers. A script rebuilds every measure from the source files with separate code and compares the results with the chart. A separate check, written from scratch without our code, pulled the data again and compared its results with the chart. Both matched every value in the chart.
How we built the health index
The health index puts 14 CDC health measures into one number for each tract, from 0 to 100, where higher means healthier. Here is every step.
Step 1. Start with 14 measures. Each is CDC's estimate of the share of adults in the tract who have the condition or behavior:
- Physical health: obesity, diabetes, high blood pressure, coronary heart disease, COPD, any disability, frequent physical distress (14 or more bad physical health days in the past month), and fair or poor general health.
- Mental health: depression (ever told by a health professional) and frequent mental distress (14 or more bad mental health days in the past month).
- Behaviors: current smoking, binge drinking, no physical activity outside of work, and short sleep (under 7 hours a night).
For all 14, a lower share is better.
Step 2. Rank every tract on each measure. The measures sit on very different scales. A typical tract has about 34% of adults with obesity but about 6% with coronary heart disease, so the raw shares cannot simply be added. Instead, each tract is ranked against every other tract in the analysis, about 78,000 in all, one measure at a time, and given a score from 0 to 100. The score is the share of tracts doing worse on that measure. A tract whose obesity rate is lower than 90% of tracts scores 90 on obesity. A tract in the middle scores about 50. Tracts with the same value share the same score.
Step 3. Average the 14 scores. Every measure counts the same. Smoking counts as much as diabetes, and depression as much as high blood pressure. A tract needs scores on at least 11 of the 14 measures to get an index.
Step 4. Stretch the result to run from 0 to 100. Averages of ranks bunch toward the middle, because few tracts are best or worst on every measure. So the averages are rescaled: the tract with the lowest average is set to 0, the highest to 100, and every other tract keeps its place in between.
What the index tells you, and what it does not. It tells you where a tract stands compared with other U.S. tracts on these 14 measures together. It does not measure health in absolute terms. A score of 60 does not mean a tract is 60% healthy, and a gap of 10 points does not mean the same thing everywhere on the scale. Because it is built from CDC's model estimates, it carries the same limits as those estimates (see the notes below).
What is left out. Food insecurity, loneliness and lack of emotional support are in the chart but not in the index, because CDC has them for only 39 states and DC.
Counties follow the same four steps, using CDC's county estimates and ranking each county against the other counties.
The economic index follows the same four steps with 12 economic measures, each turned so that higher is better: median household income; the share of people at or above 200% of the poverty line; labor force participation and the share employed, ages 25 to 54; the unemployment rate; labor force change since 2015-2019; the share of households paying over 30% of income for housing; median rent as a share of income; and the shares of households receiving SNAP or cash public assistance and of people on Medicaid or without health insurance. A tract needs at least 9 of the 12.
Honest notes and limitations
These are the main limits. The full list is in DATASETS.md and under "Show notes and disclaimers" at the bottom of the chart.
- No tract health number is a direct measurement. Each one is a CDC model estimate, and the ranges around them are wide: the typical tract's obesity estimate has a 95% range about 10 points wide. CDC asks users not to rank places with these estimates. Our index uses ranks only to put 14 measures on one scale; it is not a ranking of places, and no single tract's score should be read as one.
- Part of the income link is built into the health estimates. CDC's model uses county and tract poverty as inputs, so part of the link between income and the health estimates comes from the model itself. The county death measures do not depend on that model.
- Kentucky and Pennsylvania are not shown. The 2025 PLACES release has no estimates for these two states for the measures based on 2023 survey data.
- Income numbers are estimates too. The typical tract's median household income has a margin of error of about 21% of the estimate, and more in lower-income tracts. The Census Bureau filled in some or all of the income answer for 37.8% of households.
- Death counts are blank for many small counties. Counties with too few deaths have no value: more than 1 in 3 counties for overdose deaths and nearly 1 in 4 for suicides. Overdose rates are not adjusted for age.
- Health estimates are not adjusted for age. Tracts with older residents show more chronic disease partly because of age.
- Food insecurity, loneliness and lack of emotional support are available for 39 states and DC only, and are not in the health index.
Reproduce it yourself
The code, the data sources and the full method are at github.com/Data4ThePeople/TractEconHealth. Every step is in the scripts, in order. If you get a different number from us, tell us, and we will look.
Common questions
Is income linked to health in the United States?
In this data, closely. Across 77,708 census tracts, the rank correlation between median household income and a health index built from 14 CDC measures is 0.82. Part of that link is built into CDC's estimates, which use poverty as an input. At the county level, income also tracks life expectancy from death records, at 0.73.
Does health keep improving at higher incomes?
Yes, in this data, though more slowly. Above about $110,000 in median household income, the health index rises about 27% as fast for each added dollar as it does below that level. It still rises in each of the 45 states with enough tracts to test.
Is life expectancy linked to income by county?
Yes, closely. Life expectancy comes from death records, not a model, so it is the cleanest check in this chart. Split U.S. counties into 20 equal-size groups by median household income, and the middle county's life expectancy runs from 70.7 years in the lowest-income group to 80.8 years in the highest. The rank correlation is 0.73. A 2016 study that matched tax records to death records for millions of Americans found that life expectancy rises with income at every income level.
Which counties have the lowest life expectancy?
Among the counties in this chart, the five lowest, for 2021 to 2023, are all in South Dakota: Buffalo County (52.9 years), Dewey County (57.3), Oglala Lakota County (58.4), Corson County (58.5) and Todd County (58.5). All five are small, so each figure has a wide range around it; Buffalo County's published range runs from 48.8 to 57.1 years.
Is income linked to obesity and diabetes?
In CDC's estimates, yes. Split census tracts into 20 equal-size groups by median household income. In the lowest-income group (median income about $31,000), the middle tract has 45.8% of adults with obesity and 20.2% with diabetes. In the highest-income group (about $197,000), it is 23.6% and 8.6%. These are model estimates built partly from poverty, so part of the link is built in.
What is a census tract?
A small area the Census Bureau draws to hold about 4,000 people. Tracts are often used as a stand-in for neighborhoods.
Where does the health data come from?
From CDC's PLACES project, 2025 release. CDC uses a national health survey, each area's population makeup and its poverty level to estimate how common each condition is in every tract and county. The numbers are estimates, not counts.
Why are Kentucky and Pennsylvania missing?
CDC's 2025 PLACES release has no estimates for either state for the measures based on its 2023 survey, which covers 13 of the 14 measures in the health index.
Can I see my county?
Yes. Switch Show to Counties, pick your state in the Area menu, and hover over the dots. In the tract view, each tract's box names its county.
Does higher income cause better health?
This chart does not test that. It shows which places have both higher incomes and better health estimates. Many other things, such as age, access to care and the CDC model itself, may sit behind the pattern.
Is the chart free to use?
Yes. It is free to use and needs no sign-in.
Support Data That Serves the Public
Data should empower people, not just institutions. Your support helps us create accessible research, visualizations, and tools that uncover economic inequality and inform better decisions.
Donate
Enjoying this post?
Tell others about it.
More articles like this
Fetching Related Posts
There are no other articles tagged with Visualization