
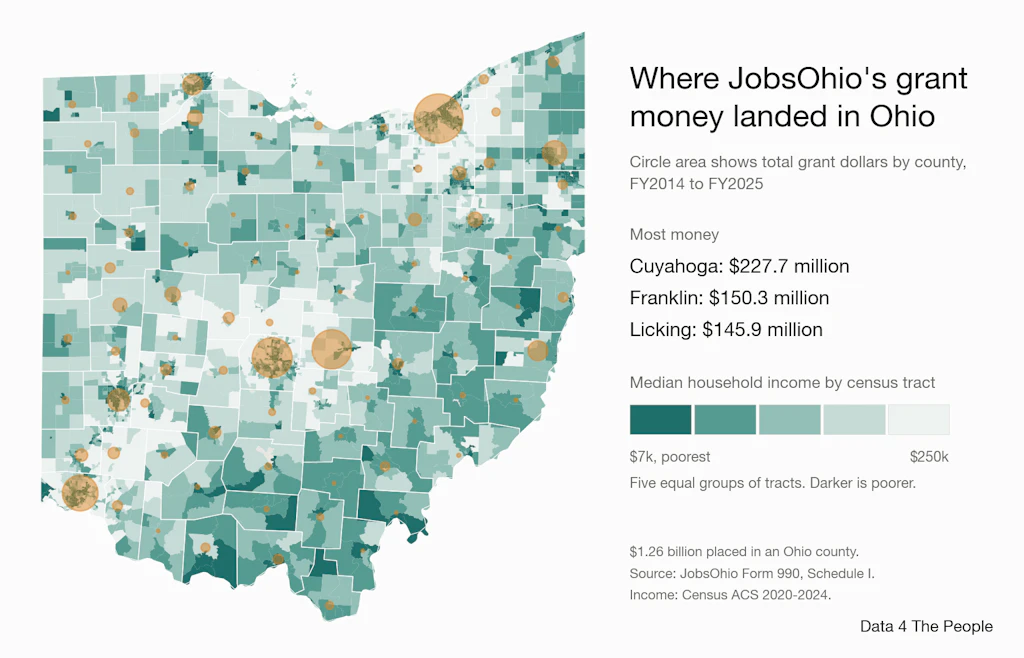
Where JobsOhio's grant money landed in Ohio
A county map of 12 years of grants, set against income in 3,115 census tracts, and a question: should economic development and public health be planned together?

Eric Pachman
Published
November 17th 2026
Yesterday we focused on who got JobsOhio's grants. Today we focus on where.
But before we get to that, we need some additional context to fully appreciate why it matters so much where Ohio makes its investments. This context comes from a single question: Should economic development be a separate initiative from public health? Ohio’s decision to carve its economic development arm out from state government suggests it views these as separate and distinct tasks. But are they?
We will explore the link between income and health in much more depth this Friday, across the whole country. But today, we are releasing a sneak peek of this work. The GIF below cycles through a handful of scatter plots comparing a health measure to median household income for 3,115 census tracts in Ohio. The health numbers are CDC estimates built partly from each tract's makeup, not counts. These charts suggest a strong link between community health outcomes and community income.
Income: Census Bureau, American Community Survey 2020-2024. Health: CDC PLACES 2025, model-based estimates. Rank correlation runs from −1 to 1; 0 means no pattern.
To be clear, we are not trying to prove this today (even though to us, the connection between income and health seems very logical) but rather pose this question. Should a program like JobsOhio consider that there could be health benefits to its economic development efforts? Could lifting up our most vulnerable communities by making investments in them to bring jobs and higher incomes, improve health outcomes, and eventually lower the health care burden for the state?
It’s at least a question worth asking. And if the answer is yes, where the money goes matters as much as who gets it. The map below shows median household income by census tract, with JobsOhio's grants by county on top. By total dollars, the big circles are where you would expect them to be if economic development was done in isolation: in and around the big cities, where large employers (who, as we learned yesterday, are getting the lion's share of the grants) are more likely to want to locate.
$1.26 billion placed in an Ohio county, FY2014 to FY2025. Source: JobsOhio Form 990, Schedule I. Income and population: Census Bureau, American Community Survey 2020-2024.
A different approach could be to aim at the communities most in need of help, and to bring industry where Ohio wants it to go, where it can add the most value. That is easier said than done. Money and health may go hand in hand, at least up to a point. If they do, Ohio needs a way to aim economic development with precision. That leaves a question for Ohio: does JobsOhio's current structure allow for that, or are changes needed so that Ohio's economic development is not blind to its effect on public health? On Friday we take the income and health question national, with a study of census tracts across the country.
The data and code behind both charts are free on GitHub.
Support Data That Serves the Public
Data should empower people, not just institutions. Your support helps us create accessible research, visualizations, and tools that uncover economic inequality and inform better decisions.
Donate
Enjoying this post?
Tell others about it.
More articles like this
Fetching Related Posts
There are no other articles tagged with Data 4 Thought