

This One Chart Keeps Me Up at Night
Social Security's days are likely numbered

Eric Pachman
Published
May 19th 2026
You Hear That? Social Security's Clock is Ticking.
Every day I'm studying public data, trying to understand the forces hollowing out the American middle class.
Over time, this research becomes data visualizations and analysis on Data 4 The People - but that takes time, especially while I'm figuring out how to turn this from a hobby into my life's work.
I don't want to wait anymore. I want to bring you along on the journey through the data - and I want your input. This work doesn't need to happen in a vacuum. There are 123 of you on this mailing list who care just as deeply about this country as I do.
So let's dig in.
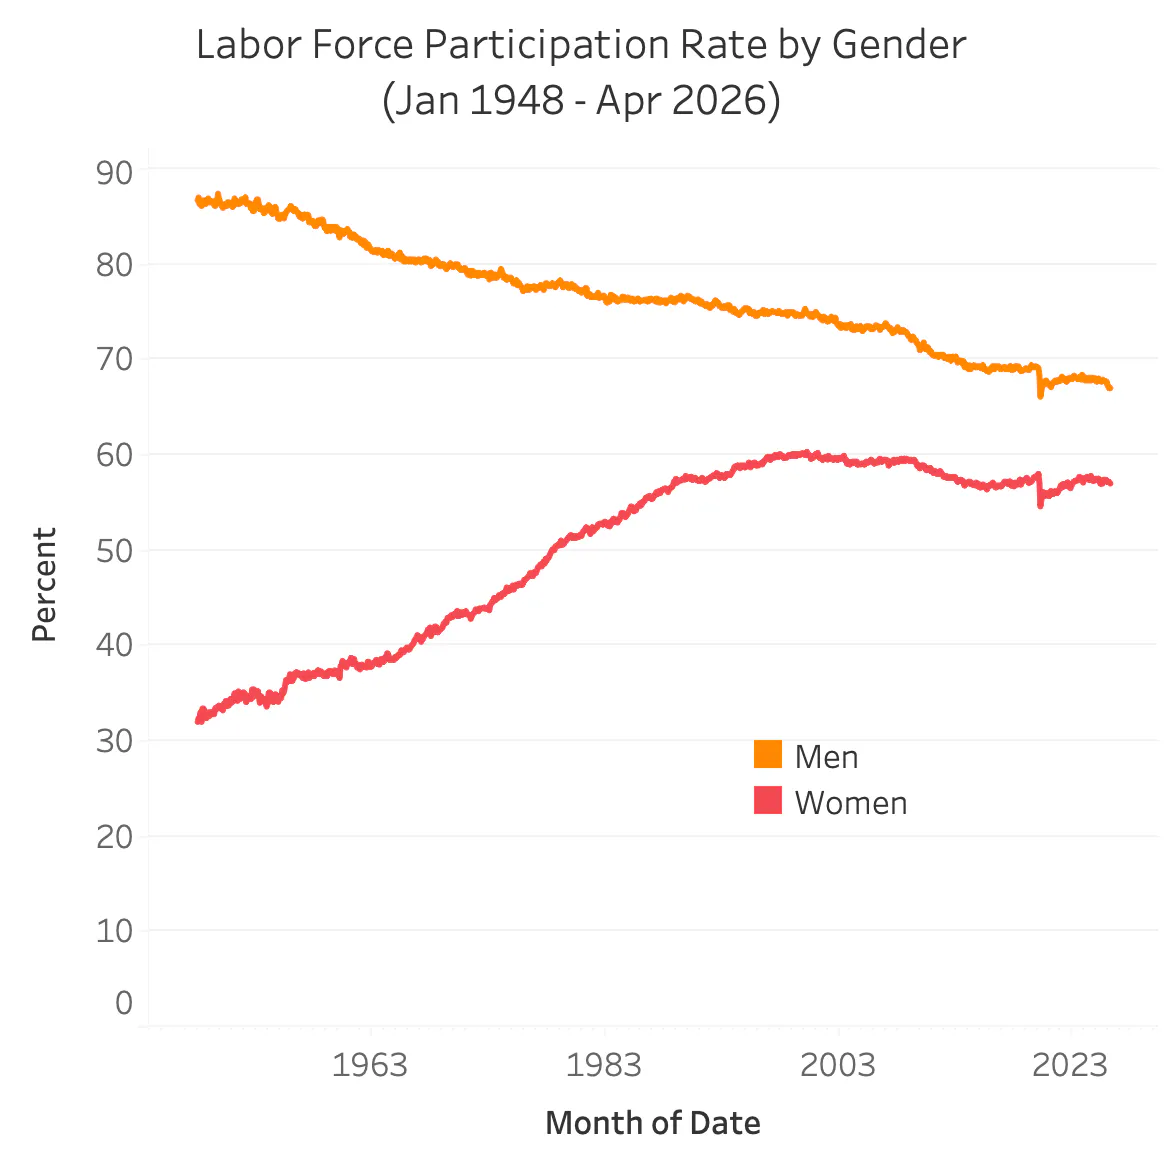
Source: BLS
I'm not here to relitigate the history of women entering the workforce - the chart tells that story clearly. What fascinates me is the last two decades: participation declining for both genders.
There are real drivers behind this. An aging population is the biggest - Boomers are retiring in droves. Technology has also changed how much output an economy can squeeze from fewer workers, though economists debate how much this suppresses participation versus simply reflecting it. We'll do a full deep dive on the causes in the future.
But here's what should concern everyone right now. The Boomer retirement wave accelerated in the 2010s. The Social Security trust fund peaked in 2017, has declined every year since, and is projected to be depleted by the early 2030s. We need workers paying in to support those drawing benefits. Can wage growth offset falling participation? And if wages rise, will inflation eat the gains?
Without intervention, we're not looking at a one-time adjustment - we're laying the foundation for a long-term structural decline in Social Security payouts. Based on current projections, beneficiaries could see roughly a 20% cut in the early 2030s if Congress doesn't act. The data suggests this is just the beginning.
Now consider this: according to the Census Bureau's own Supplemental Poverty Measure interactive tool, 47% of Americans 65 and older would have fallen into poverty in 2023 without Social Security.
A 20% cut to a program that is the last line of defense against poverty for nearly half of all seniors is not a future problem. It is an emergency hiding in plain sight.
So here's my question for you: what do you think is the most under-appreciated driver of declining labor force participation — and what, if anything, can reverse it?
We're deep in research on this topic. Your answer could shape where we go next.
Support Data That Serves the Public
Data should empower people, not just institutions. Your support helps us create accessible research, visualizations, and tools that uncover economic inequality and inform better decisions.
Donate
Enjoying this post?
Tell others about it.
More articles like this
Fetching Related Posts
There are no other articles tagged with Data 4 Thought