
Visualizing World River Levels
Daily records from 16 rivers, from the Rhine's record low at Kaub to Lake Mead's lowest level since 1937

Eric Pachman
Published
October 21st 2026
One of my favorite things to do at Data 4 The People is talk to readers, especially when they have amazing ideas for new visualizations. This is starting to happen more often, which is good news for both of us – I get to learn something new, and you don’t have to read another post about crack spreads. 😂
Last week, I had a wonderful call with Chris Niksch, a Europe-based D4TP reader who happens to know all sorts of stuff about energy markets. During our discussion, he made a comment that birthed today’s visualization – he mentioned that people (at least here in the states) underappreciate how much low Rhine river levels are complicating Europe’s diesel shortage. The Rhine has long been one of Europe’s main economic arteries, but this year the water has fallen so low that shipments of critical goods and fuels (like diesel) have been disrupted.
I was intrigued. I absolutely LOVE when multiple complex systems – in this case, rivers and global energy markets – combine like Voltron to create an even more complex system. And so, Chris and I discussed the Rhine... and then realized that if we were going to analyze the Rhine’s river levels we may as well do the same for as many rivers as possible.
A week later, we have Data 4 The People’s World River Levels visualization.
How to use the tool
The map shows 16 rivers with long, public, daily records, measured at 42 gauges in 11 countries. A gauge is a fixed spot where a government agency measures the river every day. The oldest record in the tool starts in 1858, on the Ohio River at Cairo, Illinois. The tool is free to use, and its code and data are open on GitHub.
- Pick a river. Click a river on the map, or choose one from the list at the top right. Solid blue rivers have a daily water level record. Rivers drawn as a blue line beside a dashed orange one also have a record of how much water flows past at one or more gauges. Dashed orange rivers (the Ob, Yenisei and Lena in Russia) have only the flow record. Gray rivers, such as the Nile and the Yangtze, are major rivers whose daily history is not openly published.
- Pick a gauge. The buttons at the top of the panel switch between the gauges on that river. On a phone, pinch the map or use the + and − buttons to zoom in.
- Read the water level. The drawing of the riverbank shows the latest reading against the gauge's lowest and highest daily readings on record. The number is the height of the water above a fixed mark at the gauge, called the gauge zero. It is not the depth of the river, so a gauge can read below zero while ships still float.
- Press Play. Or drag the slider to any day in the record. The speed menu runs from one month to five years per second.
- Read the chart. It shows every daily reading, with a black line for the rolling 12-month average (the 365 days up to each date). The bar below it shows how complete each year is. Lighter colors mark readings the publisher has not checked yet, and dark pink marks readings the publisher estimated.
- Flip to Flow. At 33 gauges, the switch above the drawing changes the view from water level to flow: how much water passes the gauge each second. Flow is computed from the water level, so it is least certain at the highest and lowest values.
- Read About this record. Under the charts, each gauge lists what we know about how it changed over time, such as a moved gauge or a reset zero point. Older readings are less certain, and these notes say why.
Why humans need rivers
"The world's first great civilizations arose in the fertile flood plains of rivers," according to National Geographic: the Nile in Egypt, the Indus in what is now Pakistan and India, the Tigris and Euphrates in Mesopotamia, and the Yellow River in China. The Greek historian Herodotus called Egypt "a gift of the river." Each year the Nile flooded and left behind rich silt for farming. Mesopotamia, the "land between two rivers," became the birthplace of the world's first cities. Rivers could also take as much as they gave. The Yellow River's floods earned it the nickname "China's Sorrow."
We still live close to fresh water. A 2011 study found that more than half of the world's people live within 3 km (about 2 miles) of a river, lake or other body of fresh water, and only 10% live more than 10 km away. Some of what rivers and other fresh water do for us today:
- Food. Farming uses 72% of the fresh water people take from rivers, lakes and the ground, according to the UN Food and Agriculture Organization. Fishing in rivers and lakes brought in a record 12.3 million metric tons of fish in 2024.
- Power. Hydropower made 14% of the world's electricity in 2024, according to the International Energy Agency.
- Freight. About 465 million tons of goods, worth more than $158 billion, move on U.S. inland waterways each year. In the European Union, inland waterways carried 118.0 billion tonne-kilometers of freight in 2025.
- Everything together. A 2023 report by the World Wildlife Fund put the value of water and freshwater ecosystems at $58 trillion a year, equal to 60% of the world's GDP.
We have also changed rivers a great deal. A 2019 study in Nature found that only 37% of the world's rivers longer than 1,000 km (about 620 miles) still flow freely along their whole length, without dams or other barriers.
The Rhine
Kaub is a small town on the Rhine in western Germany. Its gauge sits at what Argus, an energy and commodity price reporting agency, calls "the key Kaub bottleneck," and shippers watch it to decide how much cargo a barge can carry.
On October 19, 2026, the latest day in our data, the Kaub gauge read 13 cm (about 5 inches). On October 1, it read minus 5 cm, the lowest daily reading in our data, which starts in 1969. All four days in that record when Kaub fell below zero came this fall: September 26 and 30, and October 1 and 2. A German weather service, wetter.net, reported minus 6 cm on October 1 and called it the lowest since records began in 1880.
Remember that these readings are not the depth of the river. They measure the water against a fixed mark. What matters for shipping is where the reading sits against a few known levels on the same gauge:
- About 150 cm: the reading normally required at Kaub to fully load vessels, according to Reuters. In our data, Kaub has not reached 150 cm on any day since June 7, 2026.
- 77 cm: the official low-water mark for 2023 to 2031. Below it, the shipping channel is no longer guaranteed to be 1.90 meters deep.
- About 40 cm: the level at or below which many barges find it uneconomical to pass Kaub, according to Bloomberg. Kaub has read below 40 cm on 51 days so far in 2026. That is more than in all of 2018 (30 days), the year of the previous record low, even though our 2026 record is missing August 11 to September 14.
The chart below compares this year with 2018 and 2022, the two lowest years before this one.

Daily water level at Kaub, Germany, in centimeters above the gauge zero. 2026 readings are provisional. Sources: German Federal Waterways and Shipping Administration (PEGELONLINE), Federal Institute of Hydrology (BfG), Reuters, CCNR.
Low water means lighter loads. In August, a German shipowner told Argus that at a Kaub reading of 23 cm, a vessel rated for 1,200 metric tons could carry only 180 tons, 15% of its capacity. By August 10, Argus reported that "barge traffic along the River Rhine has largely come to a standstill" and that "product availability in western Germany, especially for road fuels, has tightened." The cost to ship oil products by barge from the ports of Amsterdam, Rotterdam and Antwerp to Basel, Switzerland, reached €276.67 per metric ton in mid-August, up from €35 on June 3, an increase of 690%, according to S&P Global Platts.
A lot of fuel moves this way. In 2025, barges carried 27.8 million metric tons of fuels, heating oils and other mineral oils on Germany's rivers and canals, according to Germany's statistics office, as reported by daswetter. One fully loaded barge carrying 2,400 metric tons of diesel would take almost 89 road tankers to replace. Switzerland's Rhine ports at Basel took in 2.43 million metric tons of liquid fuels in 2023, and the Swiss fuel industry group Avenergy says about 22% of Switzerland's oil imports arrive by the Rhine.
So was Chris right? Yes. He was. While the Rhine is not the main cause of Europe's diesel crisis (for that, read our other work) it certainly is adding logistical insult to geopolitical injury.
Kaub's daily record in our tool starts in 1969. For a longer view, we can look farther downstream at Lobith, where the Rhine crosses from Germany into the Netherlands. The Dutch water agency, Rijkswaterstaat, has published daily levels there since 1866 and daily flows since 1901. The chart below shows the lowest level and the lowest flow in each year.
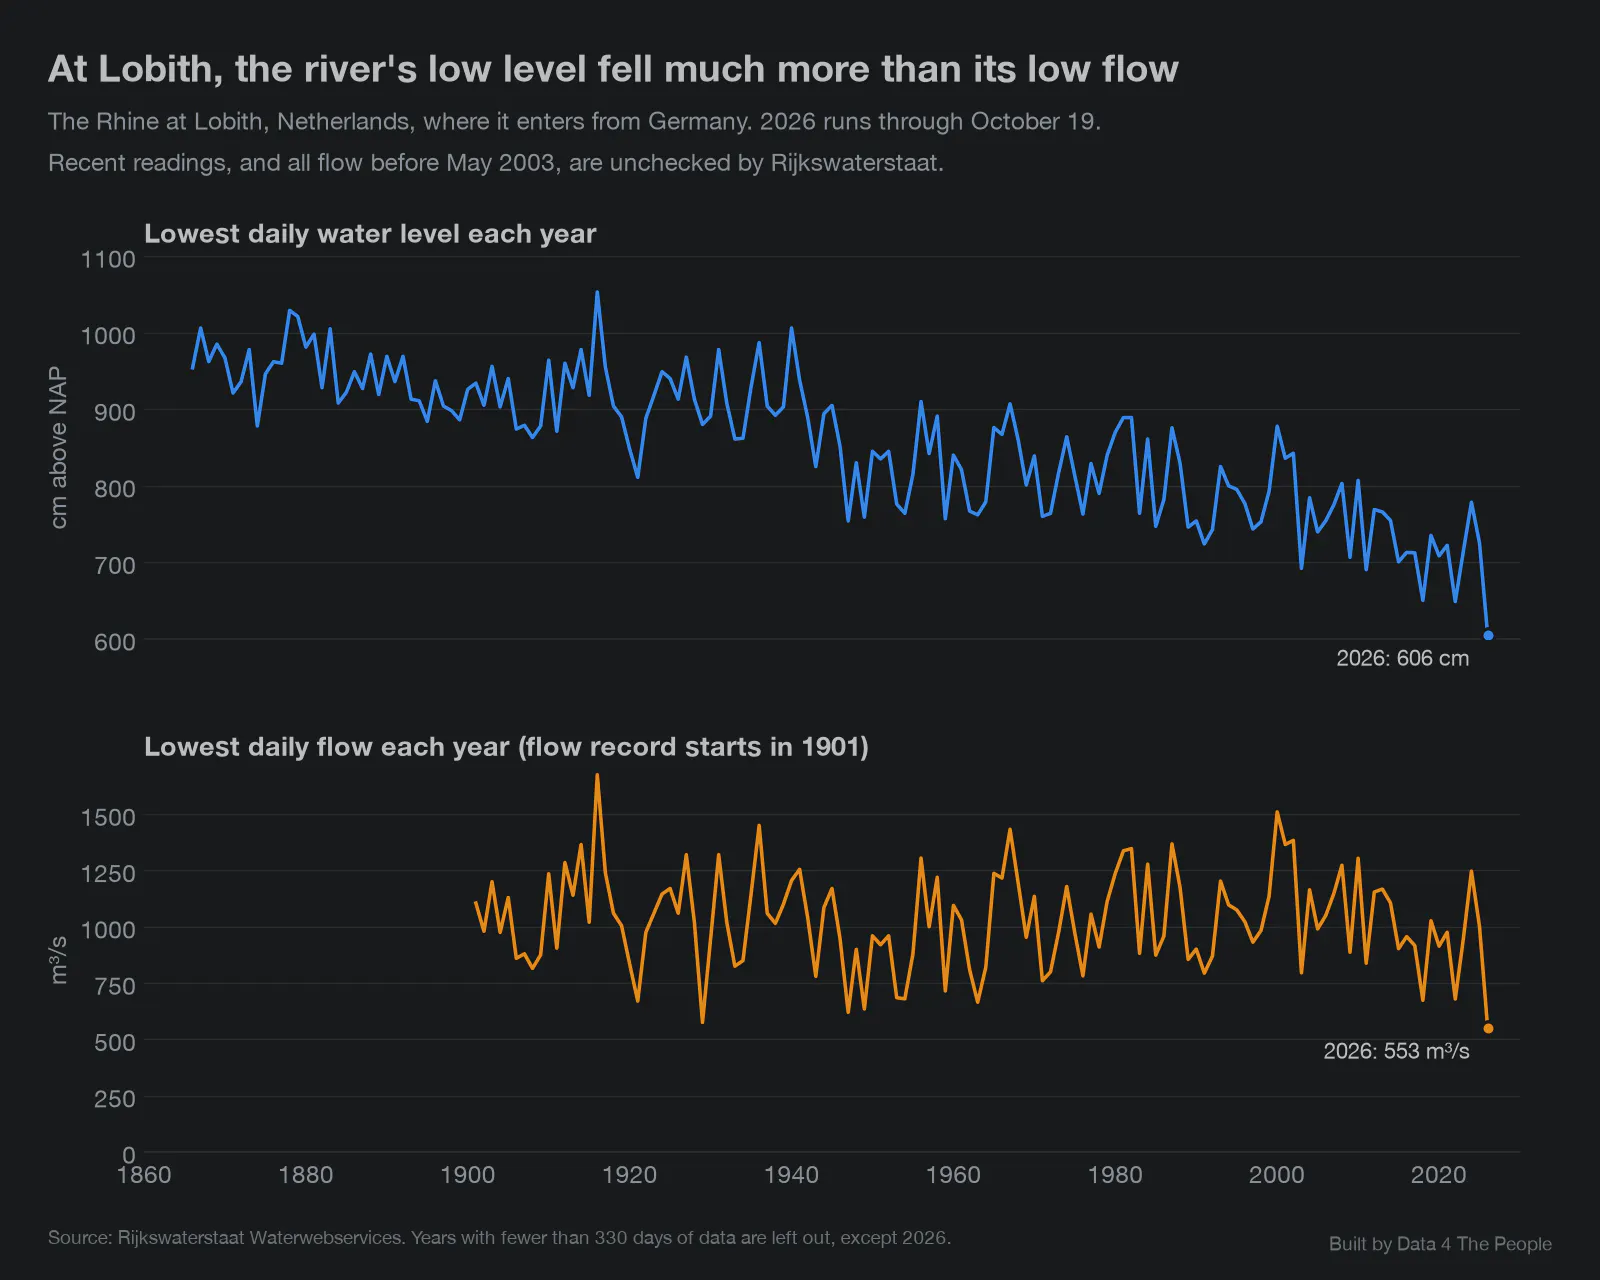
The Rhine at Lobith, Netherlands. 2026 is provisional and runs through October 19. Flow before May 2003 has not been checked by Rijkswaterstaat. Source: Rijkswaterstaat.
The two lines tell different stories. The lowest level each year averaged 947 cm from 1866 to 1900 and 711 cm from 2016 to 2025, a drop of 236 cm (almost 8 feet). The lowest flow each year averaged 1,051 cubic meters per second from 1901 to 1930 and 934 from 2016 to 2025, a drop of 11%. The data suggests that most of the long drop in level comes from the river channel itself, not from less water. Federal studies have found that the riverbed on the lower Rhine has worn lower over time, so the same flow now sits lower on the gauge. This year is different. Flow at Lobith fell to 553 cubic meters per second on October 1, 2026, the lowest daily flow in a record that starts in 1901. The next lowest was 575 in 1929.
The Colorado River
The second and last river we’ll discuss before we hand this tool over to you is the Colorado. Five years ago I was on an RV trip and we drove over what looked like a dried-up creek bed. I looked at the sign. It was the Colorado River. Yes, this is pure anecdote. It was a single location at a single point in time. But I will still never forget the sight.
That’s why I was so curious to see the Colorado River levels in this tool, which are measured at Lake Powell and Lake Mead. As shown in the chart below, both lakes have fallen to their lowest levels since they were being filled.
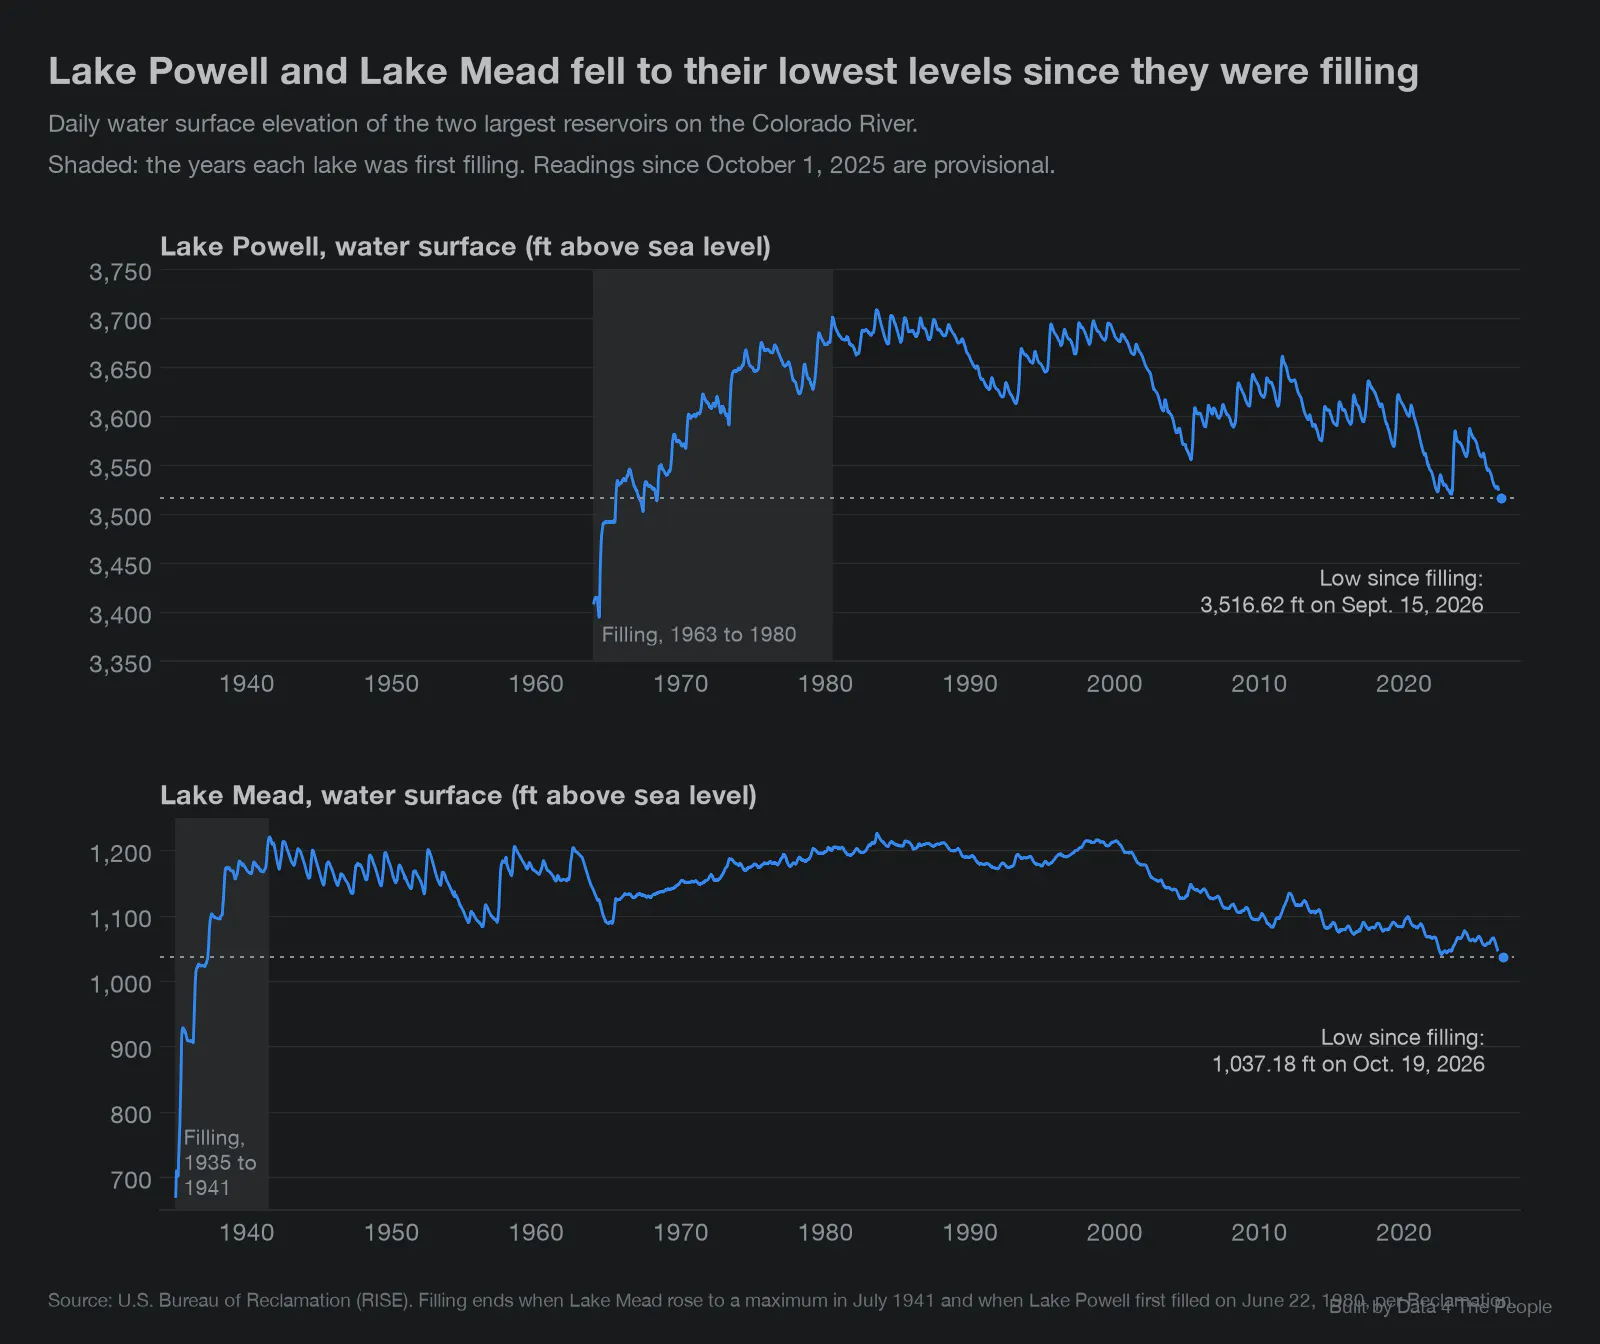
Daily water surface elevation, in feet above sea level. Shaded: the years each lake was first filling. 2026 readings are provisional. Source: U.S. Bureau of Reclamation.
Remind you of something? Our Strategic Petroleum Reserve is also at its lowest since 1982, when we were first filling it.
Lake Powell's low of 3,516.62 feet on September 15, 2026 was its lowest since May 1968. Lake Mead read 1,037.18 feet on October 19, 2026, the latest day in our data and its lowest since April 1937.
The Colorado matters far beyond the desert it runs through. It provides water to nearly 40 million people, both inside and outside its basin, and irrigates nearly 5.5 million acres of farmland, according to the U.S. Geological Survey. Farming uses 70% of Colorado River water, according to the U.S. Bureau of Reclamation, the federal agency that runs the river's largest dams. The river is shared by seven states (Arizona, California, Colorado, Nevada, New Mexico, Utah and Wyoming) and, under a 1944 treaty, Mexico. In Phoenix, Colorado River water makes up 40% of the city's water supply.
The Phoenix area has also been one of the fastest-growing places in the country. From April 2020 to July 2025, the Phoenix metro area grew by 377,643 people, or 7.8%, to 5.2 million, according to the Census Bureau. About 86% of that growth came from people moving in. On net, 195,135 more people moved to the Phoenix area from other parts of the U.S. than moved away, the second-most of any metro area after Dallas-Fort Worth, and another 127,758 came from abroad. In our view, there is an irony here. The states are fighting over a shrinking share of a river that their cities depend on, and people keep moving to one of the places that depends on it most, even as the lakes that store its water fall to their lowest levels since they were filled.
The river also makes electricity. Hoover Dam, which holds back Lake Mead, can generate about 2,080 megawatts, about 4 billion kilowatt-hours a year, enough to serve 1.3 million people in Nevada, Arizona and California. Glen Canyon Dam, which holds back Lake Powell, has 1,320 megawatts. If Lake Powell falls below 3,490 feet above sea level, the dam can no longer make electricity. Water can then leave only through tunnels that bypass its turbines. Lake Powell's September low was 26.62 feet above it, and in August the Bureau of Reclamation projected that the lake would fall below 3,510 feet during the water year that started October 1. A 2015 study by Arizona State University, commissioned by the conservation group Protect the Flows, put the river's economic value at $1.4 trillion.
Meanwhile, cities and states are fighting over the remaining water coming from the Colorado. The rules for how the river is shared run out at the end of 2026, and the seven states have been trying to agree on new ones. They missed a federal deadline of November 11, 2025 and another of February 14, 2026. The split is mostly between the Lower Basin states (Arizona, California and Nevada) and the Upper Basin states (Colorado, New Mexico, Utah and Wyoming). The Lower Basin governors said "all seven basin states must share in the responsibility of conservation." An official at Colorado's water board answered that "we can't provide water certainty for our neighbors downstream that we don't have ourselves."
On August 21, 2026, the Interior Department set the rules itself. It cut water deliveries to the Lower Basin by 1.25 million acre-feet in each of the next two years: 760,000 for Arizona, 440,000 for California and 50,000 for Nevada. (An acre-foot is enough water to cover an acre of land one foot deep.) Contributions from the Upper Basin, up to 200,000 acre-feet a year, are voluntary and come "when conditions allow." Three days later, Nevada sued the Interior Department. "This is a matter of survival," said Nevada Governor Joe Lombardo. In Arizona, the cuts come to 27% a year through 2028, and the Central Arizona Project canal will be hit the hardest. Water bills in Gilbert, a Phoenix suburb, have roughly doubled since 2024. We found no court ruling yet on Nevada's lawsuit.
My two cents:
Sit with this situation for a minute. This is the classic forest and tree situation. The states are fighting down in the trees. We can see the forest from above. States bickering are not going to solve this problem. It may be a matter of survival for Nevada, but it's a zero-sum game. If they get more, other states get less. Will states get along and make changes to conserve what's left, or will they fight until it's gone?
What can we do about this? Well, to start, pay attention to it. How many people pay attention to the second-to-second movements of Nvidia's stock price but never think twice about the rivers, lakes and wetlands that a World Wildlife Fund report valued at 60% of the world's GDP? Our species is inextricably interconnected with rivers. These seven states may soon find out what happens when that connection is broken.
Explore the data and help us improve it
Now it's your turn. Pick a river, press Play and see what you find. If something surprises you, share it with us. We may write about it next (with credit to you, of course).
This tool is built on more than a dozen public databases from agencies around the world, and many of them were new to us. Every source, rule and known limit is written down in our DATASETS.md file, and we are openly asking for your help with it. If you know a gauge, a publisher or a quirk in the data better than we do, we want to hear from you. If you find anything that needs to be updated, let us know!
What this data does not tell you
- A level is not a depth. Each gauge measures against its own zero mark, so levels cannot be compared from one gauge to another.
- Long records mix different rivers. Riverbeds wear down, gauges move and zero marks get reset, so a reading from 1900 and one from today do not always describe the same conditions. Lobith is one example. Each gauge's notes list what we know.
- Recent readings are provisional. Publishers check and sometimes revise their data months later. Kaub's 2026 record is missing August 11 to September 14.
- Flow is an estimate. Agencies compute it from the water level, and it is least certain at the highest and lowest values.
- The data is not live. The data was downloaded on October 20, 2026.
- Some rivers are missing. Many of the world's largest rivers do not openly publish their daily history. We left out the Mekong because its data license requires permission to republish.
- The tool shows what happened, not why. A low reading can come from drought, dams, water use, a change in the riverbed or several of these at once.
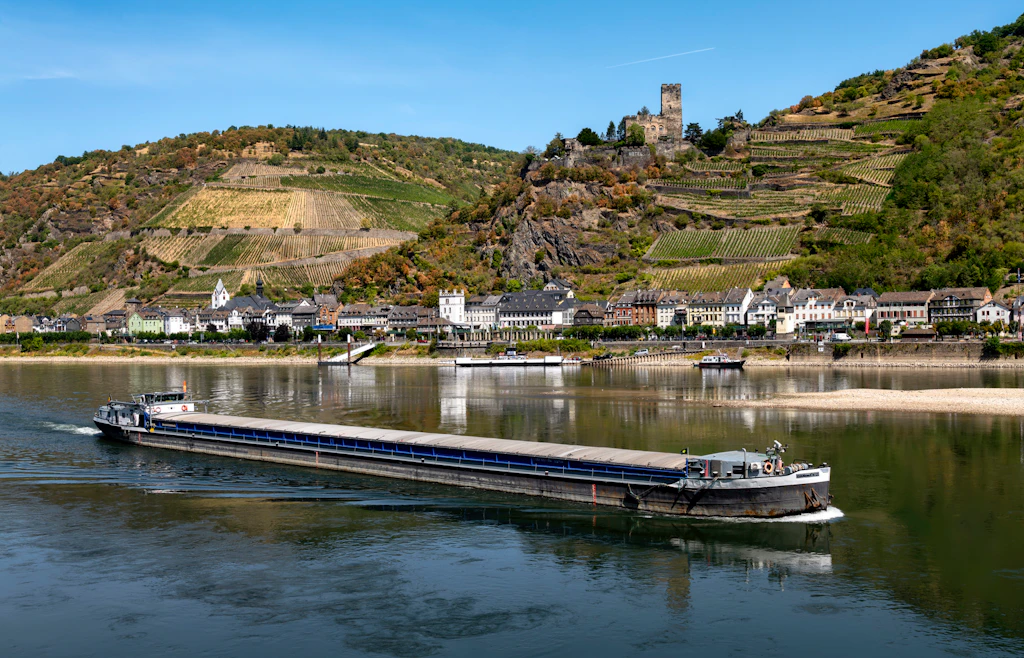
Top photo: a cargo ship passes Kaub, Germany, on August 8, 2026. Photo by Rolf Kranz, [CC BY-SA 4.0](https://creativecommons.org/licenses/by-sa/4.0), via [Wikimedia Commons](https://commons.wikimedia.org/wiki/File:Niedrigwasser_Mittelrhein_2026_-_GMS_Danimex_2_vor_Kaub.jpg).
Support Data That Serves the Public
Data should empower people, not just institutions. Your support helps us create accessible research, visualizations, and tools that uncover economic inequality and inform better decisions.
Donate
Enjoying this post?
Tell others about it.
More articles like this
Fetching Related Posts
There are no other articles tagged with Visualization