
The Stores That Stayed
Twenty years of SNAP retailers, mapped. Every store authorized to accept SNAP anywhere in the United States, 2006–2025 — 661,456 of them. An interactive map, and seven days of analysis built on it.

Eric Pachman
Published
August 18th 2026
Twenty years of SNAP retailers, mapped. Every store authorized to accept SNAP anywhere in the United States, 2006–2025 — 661,456 of them. An interactive map, and seven days of analysis built on it.
The Stores That Stayed
- 661,456 — stores authorized to accept SNAP at some point in the last twenty years
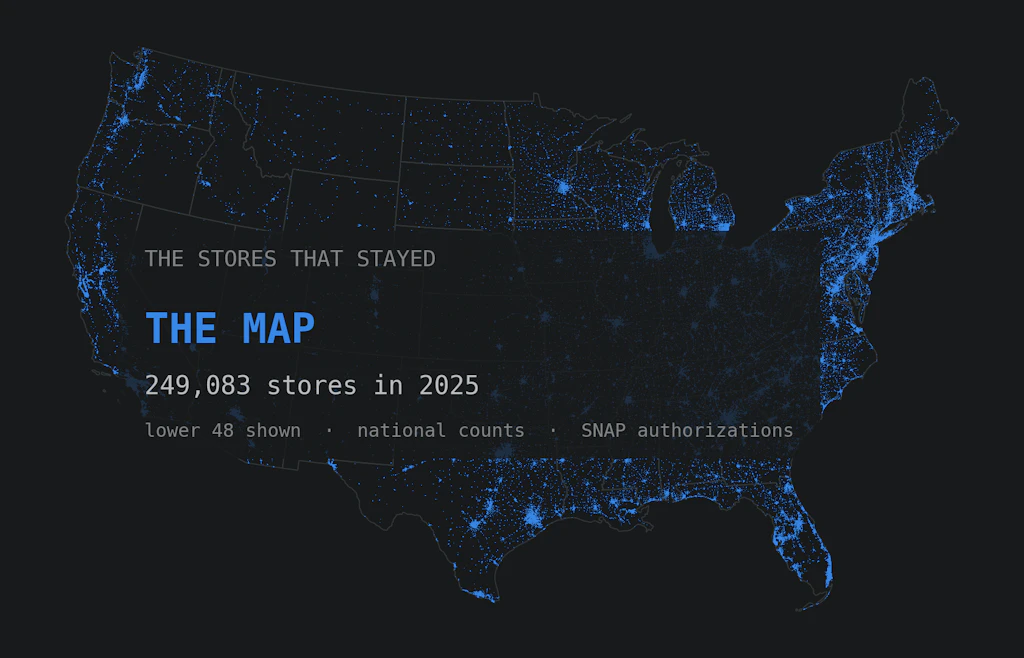
- 249,083 — still authorized at the end of 2025
- 20 — years you can move through, one at a time
SNAP is the largest food assistance program in the country. To use it you need a store that accepts it. USDA publishes a record of every store ever approved to do so, going back twenty years — 661,456 of them, each with a location, a store type, and the dates its approval started and ended.
We turned that file into a map you can explore, and then wrote seven pieces working out the story we think the data tells.
The map
It is a single web page. Nothing to install, nothing to sign into.
- Filter by store type. All 18 of USDA's categories — supermarkets, superstores, convenience stores, dollar stores, farmers' markets and the rest.
- Filter by retailer. 291 chains are named. Turn everything off, then switch on Kroger and Giant Eagle, and you are looking at two companies against an empty country.
- Move through time. One year at a time, 2006 to 2025.
One thing to know about this data
This file records authorizations, not storefronts. A store leaving the data means its authorization ended. That usually means the store closed, but it can also mean the store is still open and simply stopped accepting SNAP.
While it's tempting to conflate the change in authorizations with the change in storefronts, don't fall into that trap. They are not the same. The good news is that more research can be done to find the change in storefronts, if that is what you are after. In the coming days, anytime we use this data to gain some insight into storefront closures or openings, we will check these counts against publicly available data to see how well they match up. Usually that is a company's own reported store count, or the Census Bureau's count of business locations. We recommend you do the same, which is easier than it sounds — it simply requires asking your AI agent of choice to perform this cross check.
And where we could not make that match work, we say so and make no claim. That is why some obvious-looking findings are missing from these pieces.
Seven days, seven parts of one story
Each piece stands alone, but the argument builds from one to the next. The first six are the story. The last is an epilogue about what it means for policy.
Day 1 — One in four of the smallest grocery stores is gone
A 25% fall in small grocery businesses, by the Census Bureau's count.
Day 2 — Dollar stores cracked the code small grocers could not
Up 307% since 2006 — the steepest growth of any store format.
Day 3 — Convenience stores thrived. Most of their owners did not.
14.2% of single-owner stores lasted thirteen years. 78.7% of the fuel-selling chains did.
Day 4 — The bigger the store, the better it did — unless it belonged to a chain
78% of chain super stores kept their SNAP authorization. 46% of independent ones did.
Day 5 — The one chain format that did not work
Chain pharmacies peaked at 20,341 and have since declined to 14,828.
Day 6 — Twenty years, one pattern
Chains went from 39% to 50% of every SNAP retailer in the country.
Day 7 — In November, the rules change for the stores that are left
The stores it hits hardest are 71% of SNAP retailers and 11% of SNAP spending.
What we are not claiming
This data has no prices, no floor space, and no sales. It has no idea what is on a shelf. A dollar store and a supermarket each count as one record. It also does not know whether anyone has a car. That is often what decides whether a store ten miles away is a quick errand or out of reach.
So this series is about where the stores are and what kind they are. That is a real and useful question. It is not the same as asking whether people are fed.
Source: USDA FNS SNAP Retailer Locator Historical Data, 2005–2025. 661,456 stores, 703,441 authorization spells, of which 37,941 stores hold more than one. 656,868 have coordinates good enough to map.
The map, the pipeline that builds it, and every figure in this series:
Support Data That Serves the Public
Data should empower people, not just institutions. Your support helps us create accessible research, visualizations, and tools that uncover economic inequality and inform better decisions.
Donate
Enjoying this post?
Tell others about it.
More articles like this
Fetching Related Posts
There are no other articles tagged with Data 4 Thought