
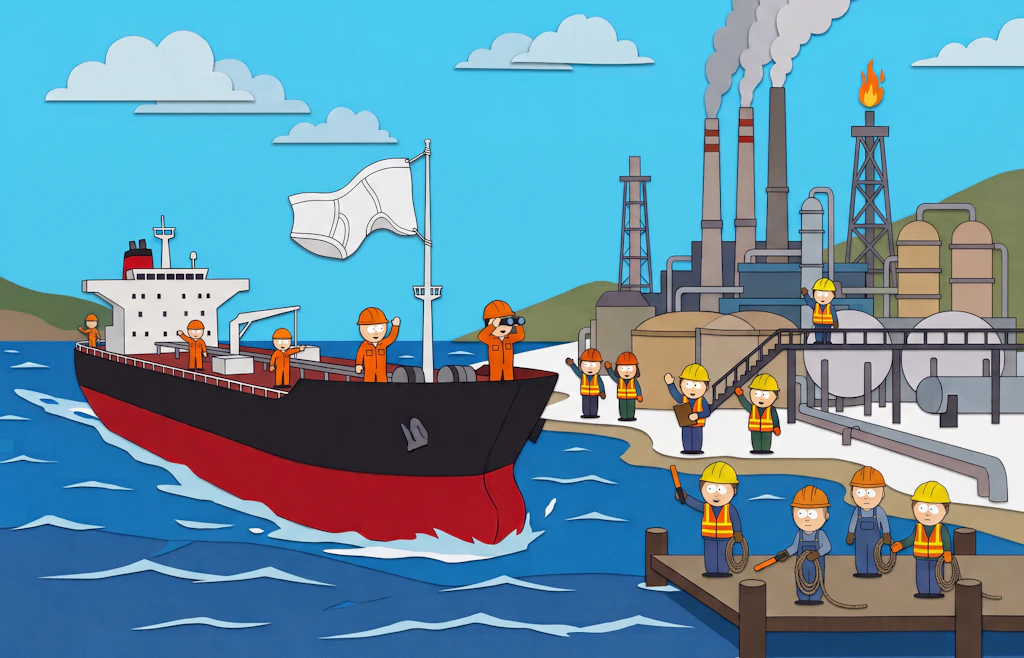
Phase 1: Hope. Phase 2: ? Phase 3: Lower energy prices
How South Park's Underpants Gnomes teach us to think like an engineer about tanker rates and energy prices.

Eric Pachman
Published
November 9th 2026
Last week I was invited back on Excess Returns for a short segment on inflation and energy markets. This episode was published over the weekend. You can check it out here.
During the episode I urged people to start “thinking like an engineer” – especially now, when the days of fact and physics being optional could be coming to an end.
What does “thinking like an engineer” mean?
Simply put, engineers are taught to study how systems work. We watch the input go into a complex system, study the many processes within the system, and then see it come out as a product that most of the public expects to magically appear on demand.
An engineer’s job is to look for bottlenecks within the system. Say step A has a capacity of 20 widgets and step B has a capacity of 10. How can we address step B to raise its capacity to step A’s, thereby increasing the capacity of the entire system? That’s what I was trained to do for oil companies.
The problem we have today is an engineer doesn’t have to spend much time investigating the process of how oil comes out of the ground and gets into your car before encountering a major bottleneck – global shipping. 76% of the oil the world consumes is carried by sea at some point in its journey. And right now, the tanker market is not just a bottleneck in the energy system, it’s facing a crisis we haven’t seen in the records we have. By mid-October, shipping a barrel of crude from the Persian Gulf to Asia on a large tanker cost more than $37, over 400% more than before the war, according to the International Energy Agency. In October, freight made up more than 40% of the price of US oil, compared with 7% on average in 2025, according to Reuters, using LSEG data.
Today’s post first explains why this war caused this chaos in tanker markets, looks at the price surge across multiple routes and vessels (I can almost hear the sirens and warning bells going off – as I would in a refinery – as I look at these charts), and challenges us to ignore the sentiment and analyze the system using data to understand how this scary situation could unfold.
How Gulf oil is getting out
Since the Strait of Hormuz was disrupted on February 28, Gulf producers have moved oil out in three ways. Some crude still crosses the strait, often on shuttle tankers that hand it off to larger ships waiting off Sohar in Oman and Fujairah in the UAE. Some is piped across Saudi Arabia and loaded on the Red Sea. Some is loaded at Fujairah, outside the strait.
The map below shows how much went each way in September, based on ship tracking by Kpler. The wider the line, the more oil.
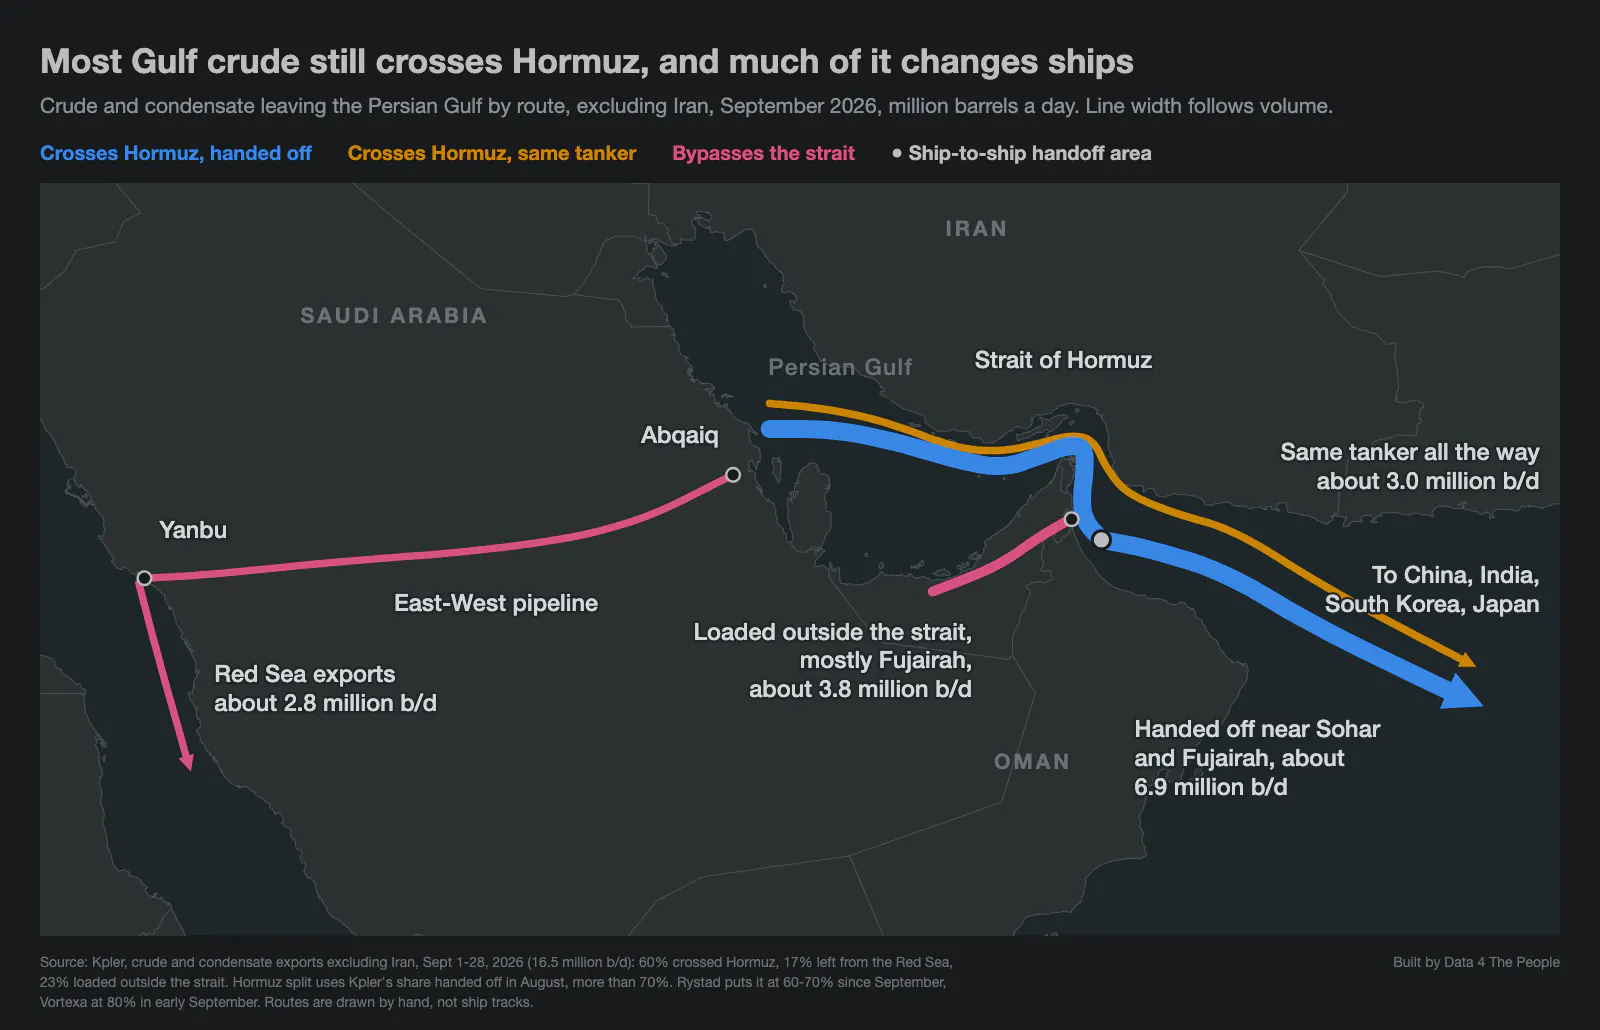
Source: [Kpler](https://www.kpler.com/blog/explainer-how-mideast-gulf-crude-exports-returned-to-pre-war-levels), crude and condensate exports excluding Iran, September 1-28, 2026.
Each of these routes uses more ships than before. A cargo that once sailed from the Gulf to Asia on one supertanker now often needs two: a shuttle to cross the strait, and a second ship to carry it the rest of the way. About 20% of the world's supertankers are tied up shuttling oil out of the Gulf, according to Braemar. Others have been taken out of service: by our count of IMO and press reports, about 11 tankers were abandoned or disabled after being hit between August 1 and November 4, three of them supertankers.
Buyers in Asia have also bought more crude from farther away. Trips from the Atlantic to Asia and the Pacific made up 35% of supertanker crude volumes in the eight weeks to early May, up from 22% before the war, according to Vortexa data reported by Lloyd's List. In August, Japan got 35% of its crude imports from the US, according to OilPrice.com.
Distance matters because a ship at sea cannot pick up another cargo. And so to transport the same amount of oil, we need more ships. The map below compares two trips to Japan.
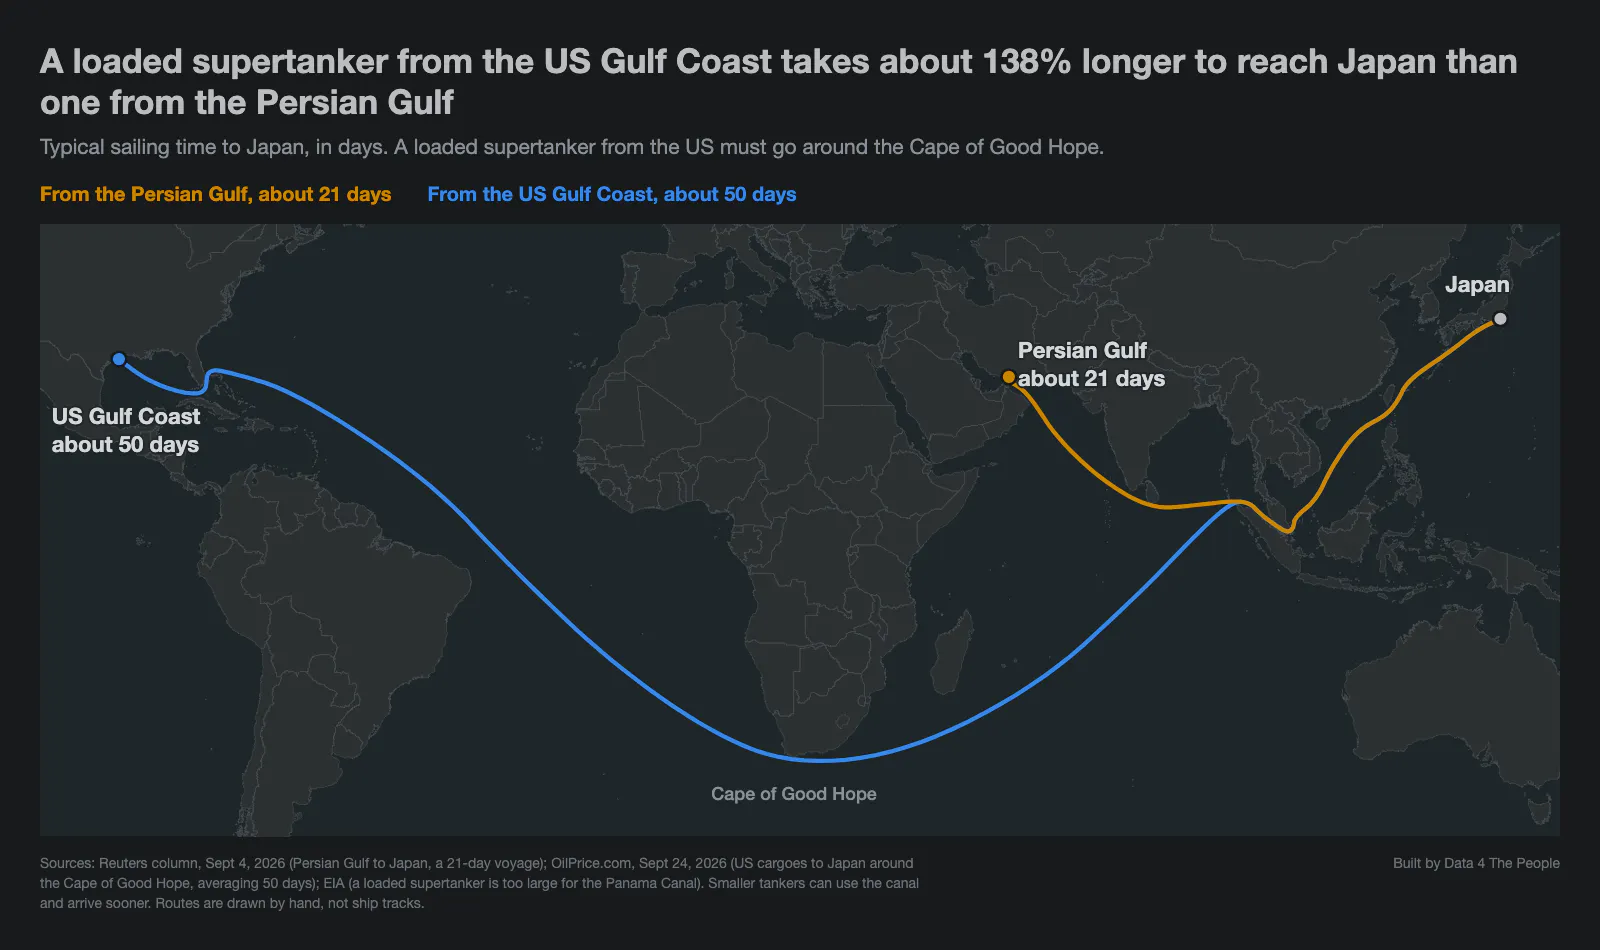
Sources: [Reuters column](https://kuwaittimes.com/article/49241/business/why-oil-importers-are-learning-to-live-with-longer-routes/), September 4, 2026; [OilPrice.com](https://oilprice.com/Energy/Crude-Oil/Soaring-Freight-Costs-Make-Japans-Crude-Imports-the-Worlds-Most-Expensive.html), September 24, 2026. Routes drawn by hand.
A loaded supertanker is too large for the Panama Canal, so a US cargo bound for Japan goes around Africa. That trip takes about 50 days, compared with about 21 from the Persian Gulf.
Longer trips are only part of the picture. Total supertanker ton-miles, a measure of cargo multiplied by distance, fell 14.5% in the first seven months of 2026 compared with a year earlier, because much less oil left the Gulf, according to Gibson Shipbrokers. The squeeze comes from how the ships still working are being used: shuttling, waiting, sailing longer routes, or out of service.
Rates spiked on every route
The route we have been following most closely is the Persian Gulf to China. The Baltic Exchange estimates what a standard supertanker earns per day on that route after fuel and port costs. The chart below shows that estimate in each weekly report since August.
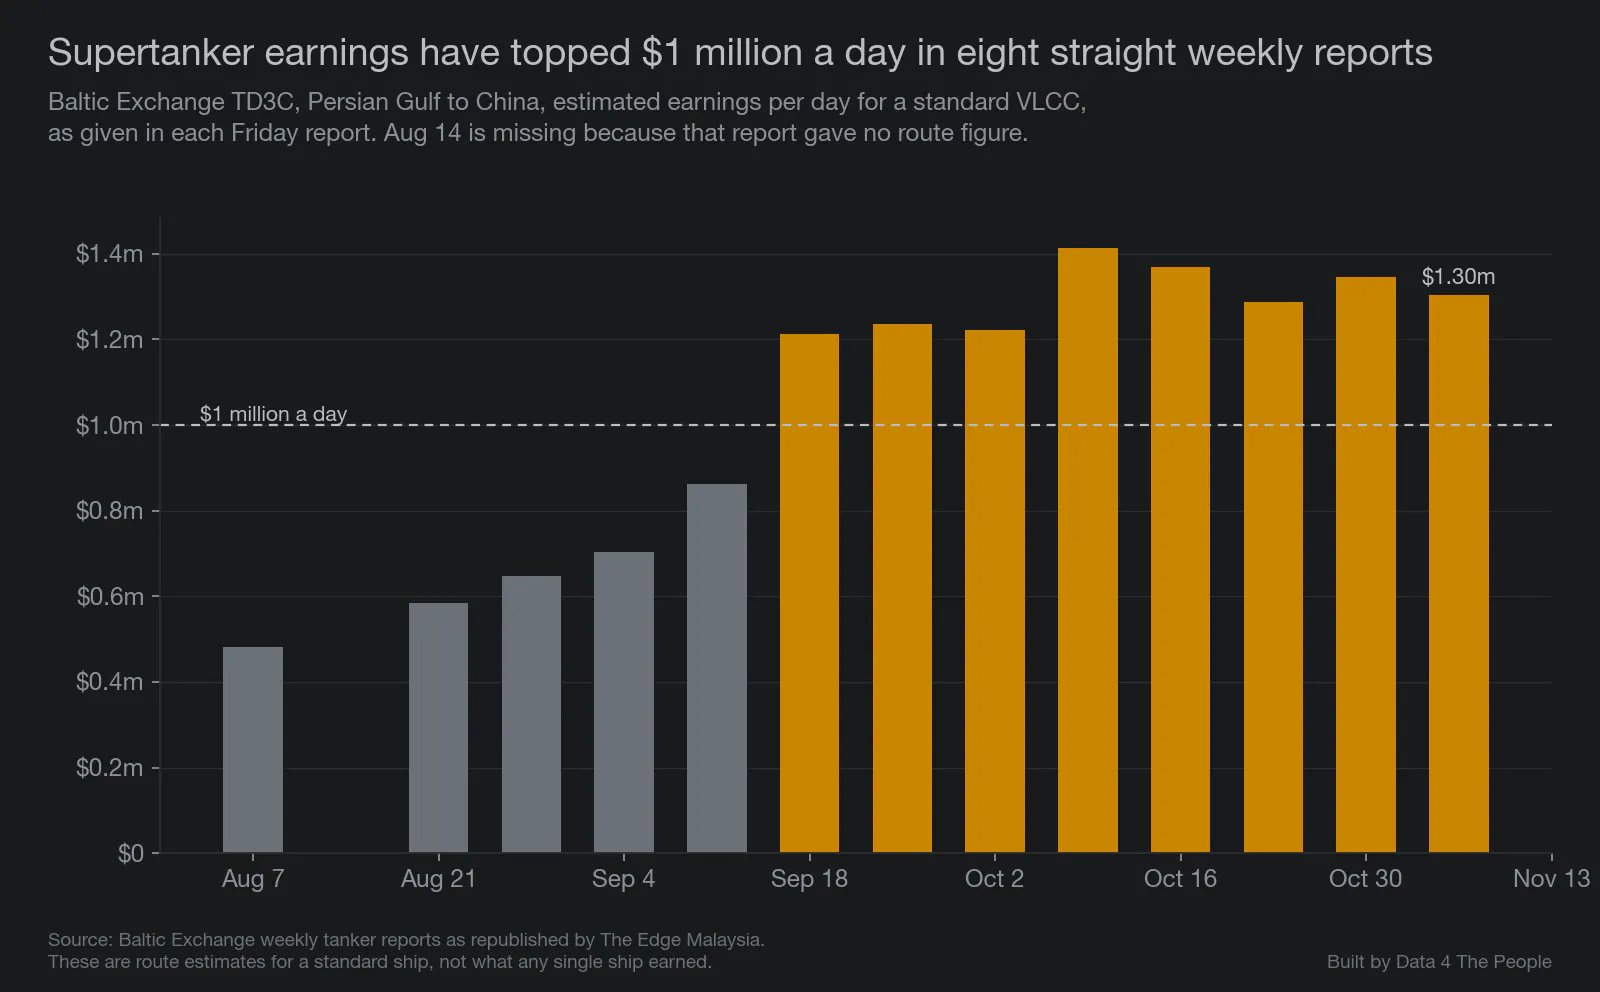
Source: Baltic Exchange weekly tanker reports, as republished by [The Edge Malaysia](https://theedgemalaysia.com/node/824924).
Earnings passed $1 million a day in the September 18 report and have stayed above it in every report since, eight in a row. The Baltic's previous supertanker record was about $264,000 a day, in March 2020, according to Lloyd's List. Its records go back to 2008.
The jump is not limited to the Gulf. The chart below shows the spot rate, the price to hire a supertanker for one voyage, on every supertanker crude route we track. Each bar compares the rate on November 6 with that route's January 2026 average.
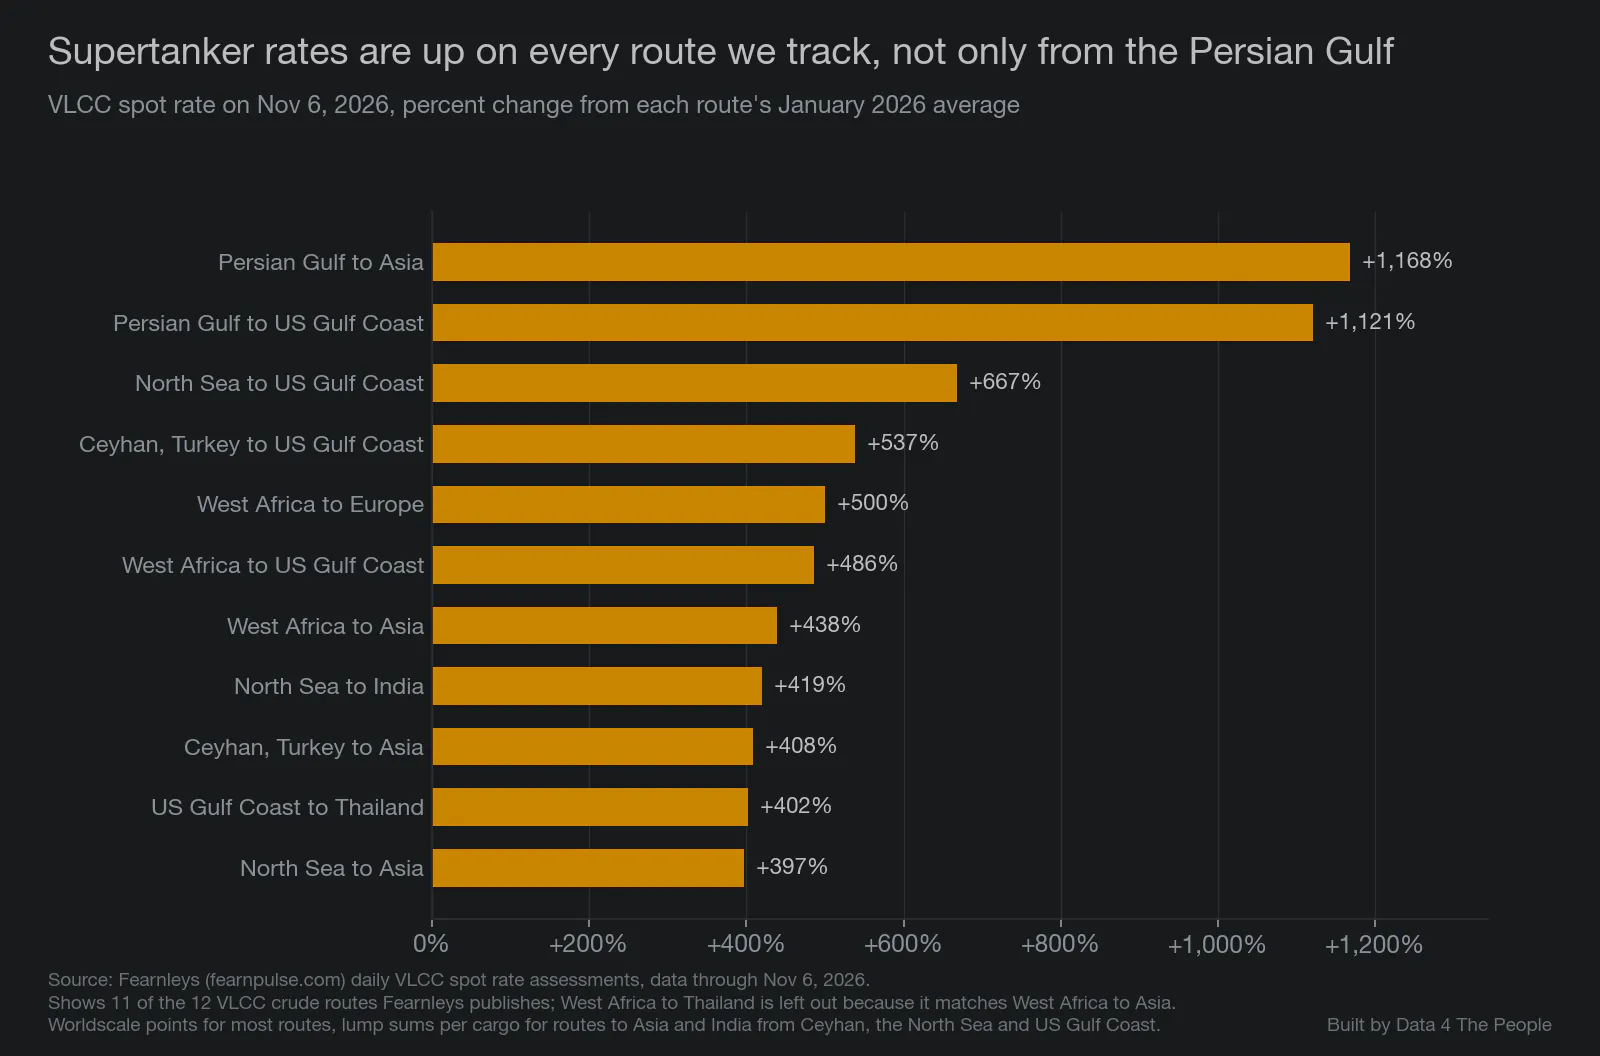
Source: Fearnleys daily spot rate assessments. Most routes are quoted in Worldscale points, an industry index that resets each January, so we compare only within 2026.
The two Gulf routes are up more than 1,100%. Every other route is up at least 397%, including routes that never come near the Gulf. Supertankers can sail from one region to another, so all of these routes draw on the same pool of ships.
The squeeze reaches smaller ships
Smaller crude tankers come next. A Suezmax carries about 1 million barrels of crude, usually on medium to long trips. An Aframax carries about 600,000 barrels of crude or fuel oil, mostly on regional trips, according to the IEA. A supertanker carries about 2 million.
The chart below follows one spot route for each size, as a weekly average compared with that route's January 2026 average.

Source: Fearnleys daily spot rate assessments, weekly averages.
Supertanker rates moved first. Suezmax and Aframax rates stayed near their January levels until September, then rose sharply. Both have eased since mid-October but were still 268% and 149% above January in the week to November 6.
Spot rates swing from week to week. The cost to hire a ship for a full year shows what owners and charterers expect over a longer stretch. The chart below shows that one-year rate for each size.
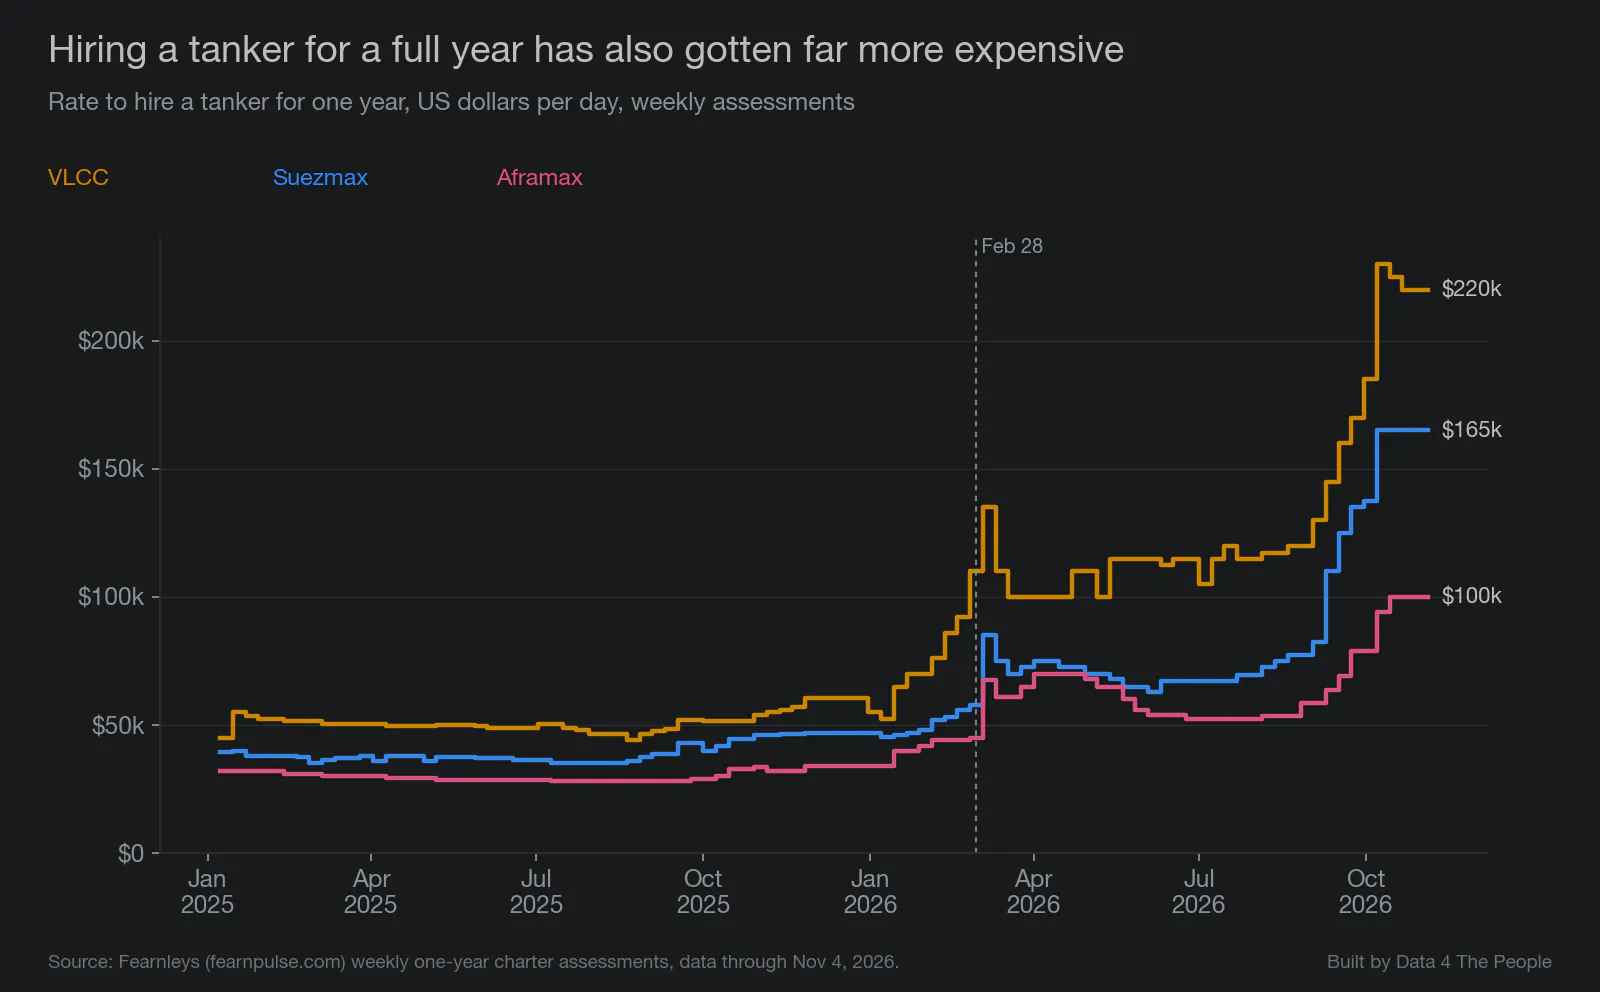
Source: Fearnleys weekly one-year charter assessments.
A one-year hire now costs $220,000 a day for a supertanker, $165,000 for a Suezmax and $100,000 for an Aframax. Before February 28, the highest rates in Fearnleys data were $110,000, $58,000 and $46,000. Today's rates are 100%, 184% and 117% above those highs.
The same squeeze shows up in ships that carry refined fuels. An LR2 tanker is about the size of an Aframax but is coated to carry products like diesel, jet fuel and gasoline, according to Drewry. The Baltic's daily earnings estimate for an LR2 from the Persian Gulf to Japan rose from $52,200 in late January to $292,000 on November 6, up about 459%. The IEA says higher freight rates "add further upwards pressure on energy costs" for countries that rely on imports. In our view, that adds pressure on the price of diesel, jet fuel and the other fuels these ships carry.
The wisdom of South Park
So, does this mean that our energy prices are going up?
In the near term, that depends on how many people think like engineers.
An engineer investigates the system and tries to understand how the changing variables (e.g., the midterm election results) can impact the bottlenecks in the system.
But the market is not driven by engineers. It’s driven by traders trying to predict the sentiment one step ahead of their peers. In the short term, markets are more a study of psychology and behavioral biases than physics. To that end, if enough traders believe that other people believe that the election results will fix oil prices, well then in the short term, they could.
But this all reminds me of one of my favorite episodes of South Park, “Gnomes.” In this episode, there is this amazing line where one of the Underpants Gnomes is explaining his business plan.
Phase 1: Collect underpants
Phase 2: ?
Phase 3: Profit
My point in bringing this up is we are going to have to figure out Phase 2 for our energy markets sometime. Traders may be just fine with gnome logic, so long as enough people believe in Phase 3. But when will people realize there is no Phase 2? What happens then?
Anyway, the good news is that to figure out Phase 2, and how that changes Phase 3 for our global energy market, all we need to do is track the data through the system and hold our views lightly as the data changes. Tanker rates are part of this. So is the SPR drawdown. So are oil inventories. So are crack spreads. We have all the data free for you to analyze at Data 4 The People.
What this does not tell you
- Spot rates are broker assessments, not a record of every deal. Fearnleys does not say how many deals stand behind each figure.
- The Baltic's daily earnings are estimates for a standard ship, not what any single ship earned. Reports in late September noted that few ships were trading on the Gulf to China route.
- The two maps draw routes by hand. They are not ship tracks.
- The count of damaged tankers is our own tally from IMO and press reports. Some attacks are claimed by only one side.
- Estimates of how much crude crossing Hormuz is handed off ship to ship range from about 60% to 80%. The route map uses Kpler's figure of about 70%.
Support Data That Serves the Public
Data should empower people, not just institutions. Your support helps us create accessible research, visualizations, and tools that uncover economic inequality and inform better decisions.
Donate
Enjoying this post?
Tell others about it.
More articles like this
Fetching Related Posts
There are no other articles tagged with Data 4 Thought