
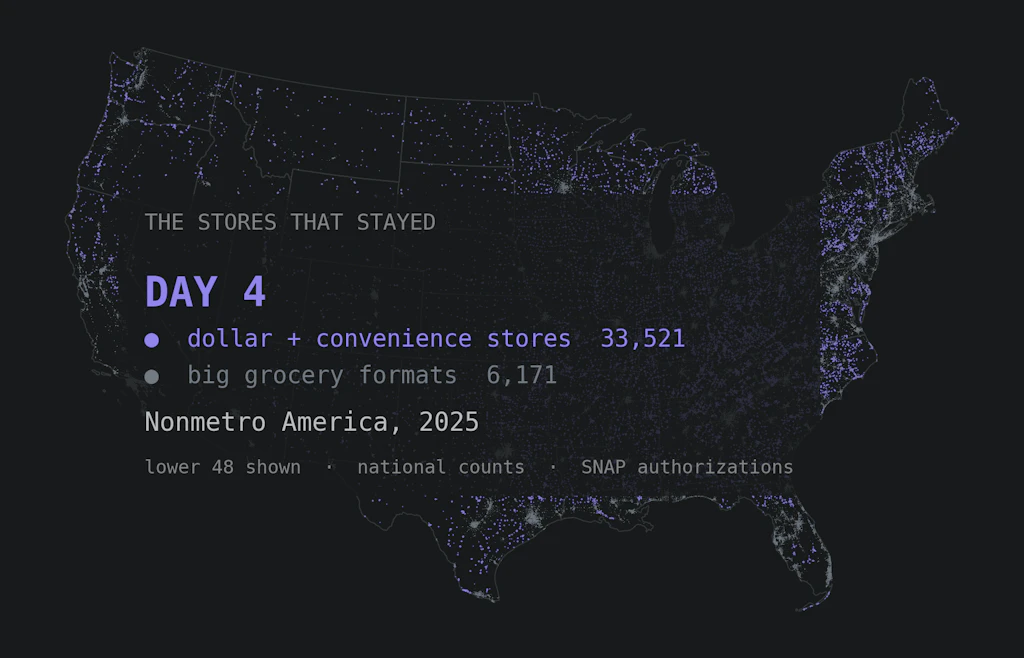
Super stores for some, dollar and convenience stores for the rest
Twenty years of SNAP data show grocery growth obeying a single variable: how close you live to a metro area. 46.3 million Americans live on the wrong side of that line.

Eric Pachman
Published
August 24th 2026
SNAP-authorized retailers, 2006–2025, joined to USDA's Rural-Urban Continuum Codes. 46.3 million Americans live in the non-metropolitan counties this piece is about.
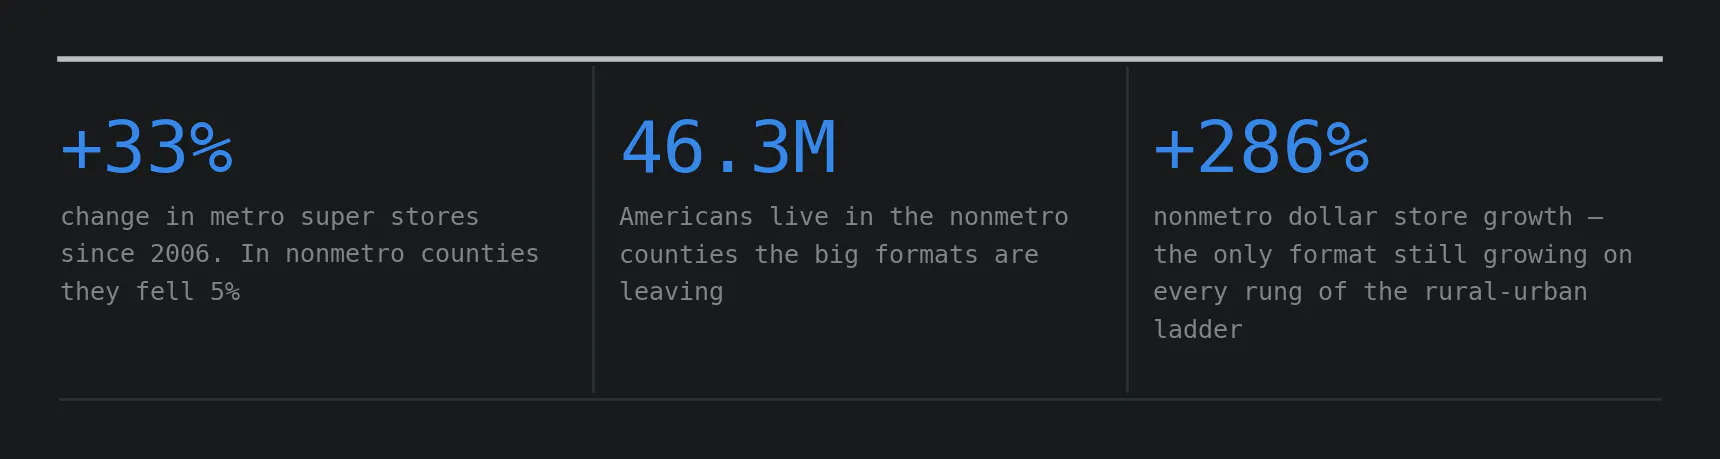
+33% change in metro super stores since 2006; in nonmetro counties they fell 5%. 46.3 million Americans live in nonmetro counties. +286% nonmetro dollar store growth — the only format still growing on every rung of the rural-urban ladder.
As in the earlier pieces: anytime we refer to "growth" in this post, it is growth in SNAP-authorized stores, not growth in store counts. See the Limits section for more on this.
My analysis for today's post made me reflect on my own life. I'm specifically thinking about the plethora of grocery options I have just minutes from my house in suburban Dayton, Ohio. There are a Target, a Costco, and a Kroger down the street from me. Drive another few minutes and you'll pass a Walmart and an Aldi. Another five minutes and there's a Trader Joe's. My weekly grocery trips involve some ever-changing combination of visits to these stores to get the products my family likes at the best price. There weren't always this many options. But large-format grocers have flocked to the metropolitan area in which I live, providing an overabundance of fully stocked grocery stores for suburban Daytonians.
Most of you reading this can probably relate. But not everyone. If you are one of the 46.3 million Americans living in a non-metropolitan county, how you shop for groceries is likely very different — rather than having more options as time passes, you may have fewer.
The two grocery Americas
How do we know that? The data, of course. The chart below shows the change in the two largest store formats — super stores and supermarkets — in metropolitan counties against non-metropolitan counties, indexed to 100 in 2006.
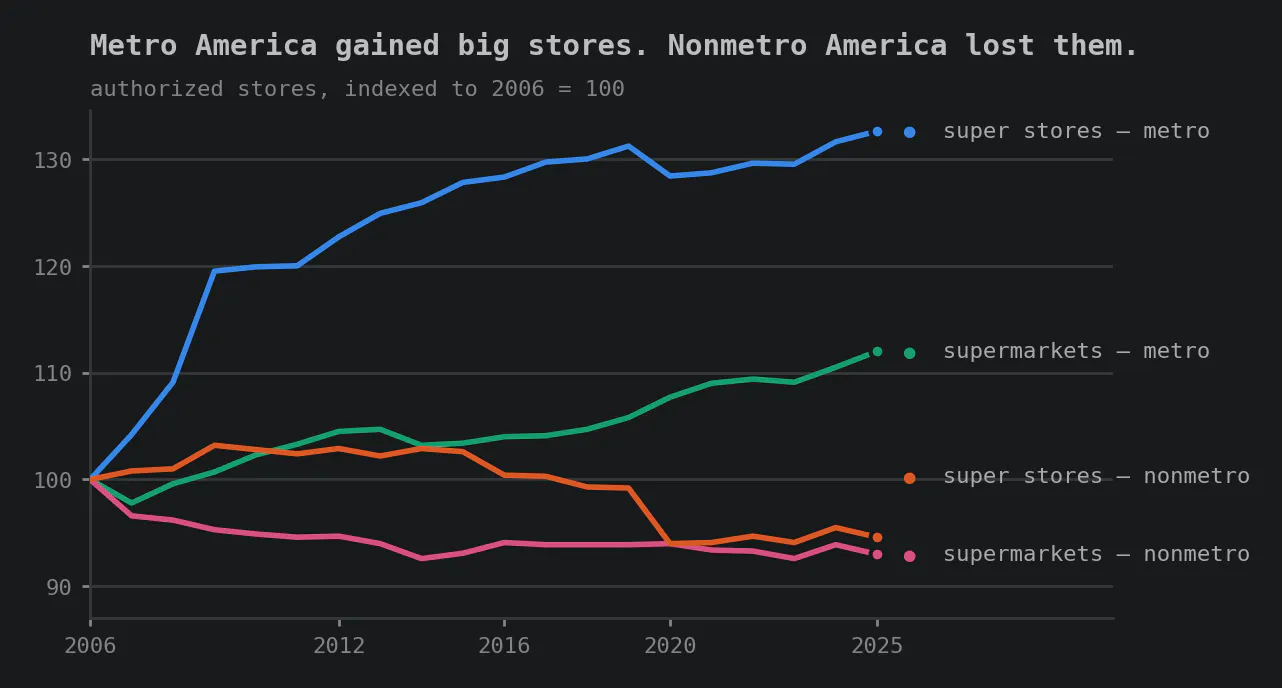
In metro counties, super stores are up 33% and supermarkets 12%. In nonmetro counties both lines point the other way: down 5% and 7%. That sharp step down in 2020 is the Kmart liquidation — 175 nonmetro Kmart supercenters left the program in a single year.
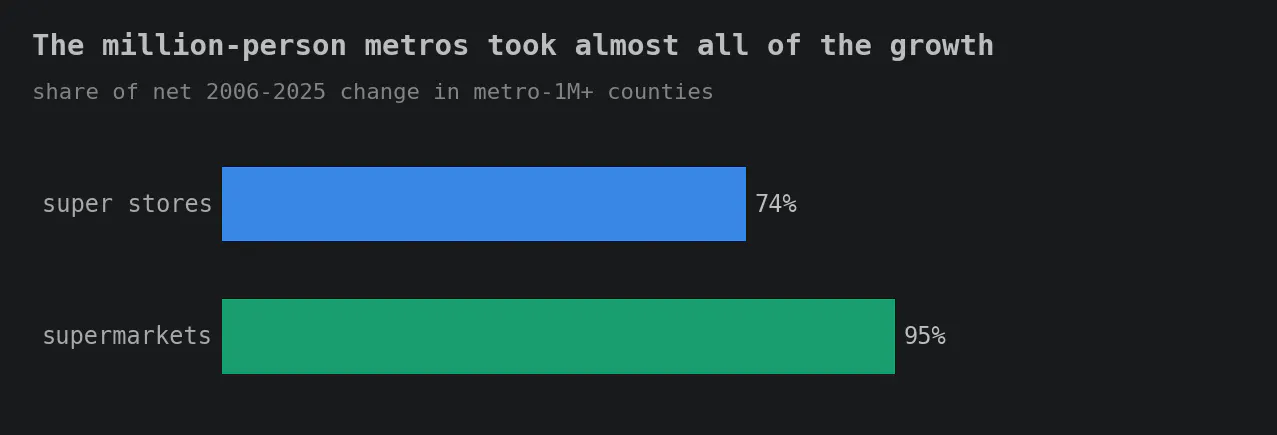
Reality is even more skewed than that chart lets on. It turns out that nearly three-quarters of all net super store growth — and 95% of net supermarket growth — happened in the million-plus metros alone.
The more we analyze and write, the more we see common threads emerging across this country. Today's finding is a complement to our deep dive into the structural decline of the labor force — an extensive piece that tracked the decline in the labor force (and therefore, the economic engine) of nonmetro counties and the simultaneous surge in the labor forces of large metro counties and their surrounding suburbs (Austin, Nashville, Salt Lake City). When a county is in structural decline, it makes sense that it would lose the larger-format grocery stores that need volume to make the economics work. Two findings from two completely different databases, connected by Ockham's razor.
What grows where the big stores don't
And so, what store formats are growing in nonmetro counties? You guessed it: dollar stores and convenience stores.
The chart below needs one piece of setup. USDA's Rural-Urban Continuum Codes sort every county in America onto a nine-rung ladder: code 1 is a county in a metro area of a million people or more, codes 2 and 3 are smaller metros, and codes 4 through 9 step down through ever smaller and more remote nonmetro counties, ending at code 9 — fully rural counties not adjacent to any metro area. The chart walks that ladder top to bottom, one row per rung, and marks each format's twenty-year growth on every one. The dollar store is the only format whose growth was indifferent to the size of the county — the smallest counties grew at nearly the same pace as the largest ones.
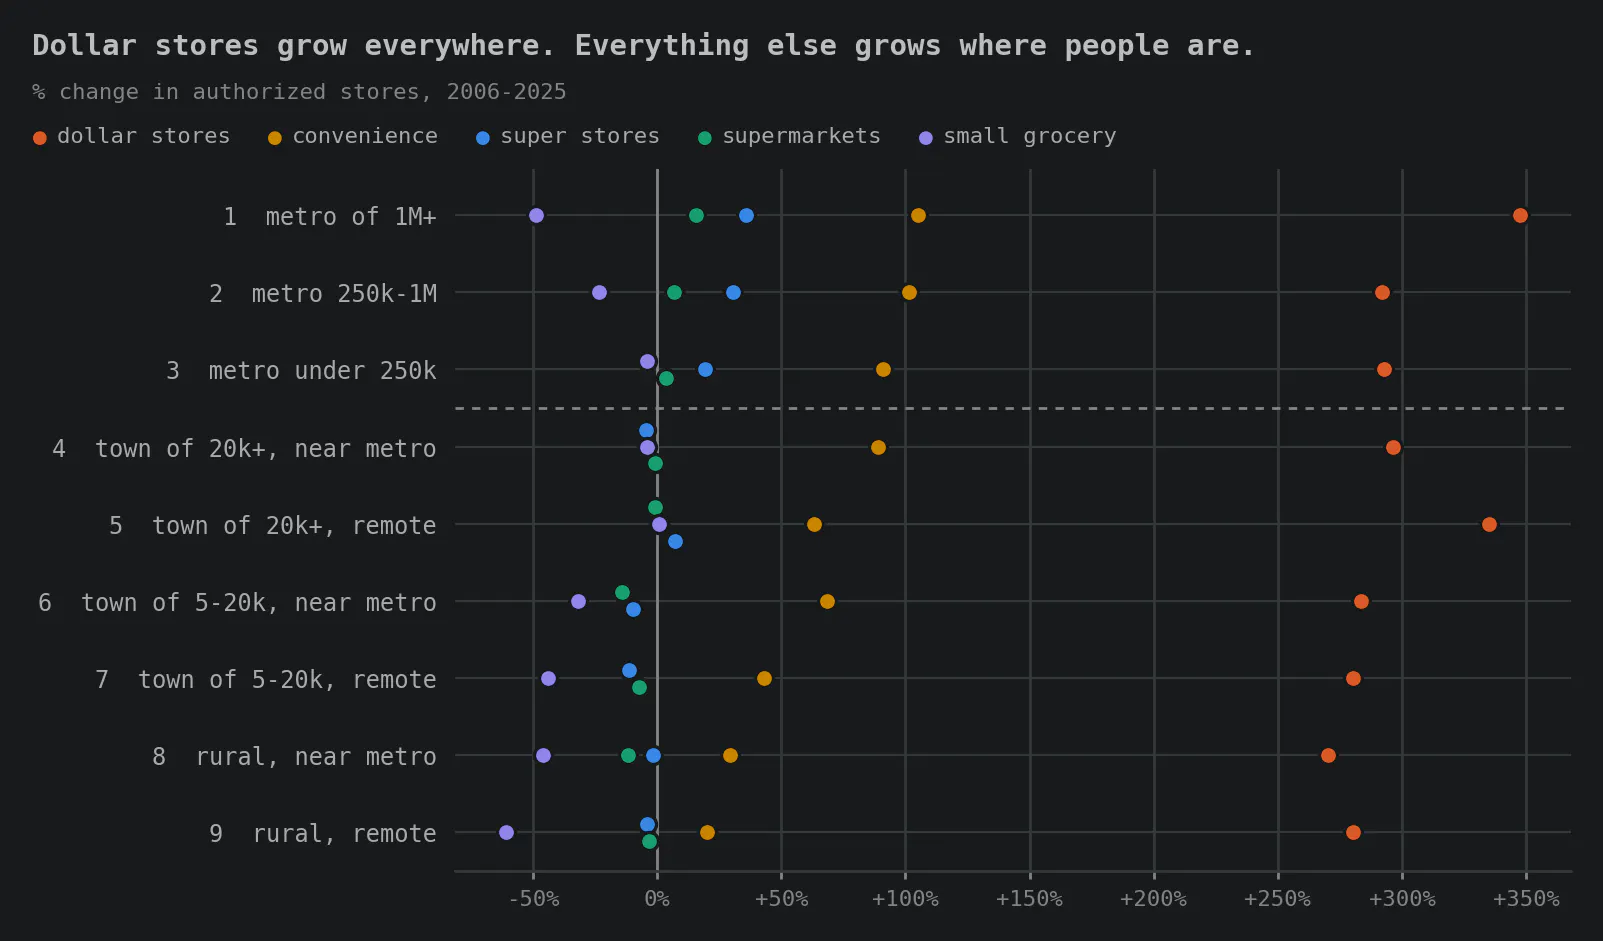
Every other format fades as you read down the ladder. Convenience stores grew 105% in the biggest metros but only 20% in fully rural counties. The big formats flip negative the moment you cross the metro line. Small grocery falls everywhere — steepest at the two extremes, the big-city bodega and the only-store-in-town. Only the dollar store's dots hold their place on every rung, a straight column at around +300%.
You are free to have your own views on these different store formats. But the data can help us remove our views from our own lived experience and try to form them from how others live. What if I lived in a small county, getting smaller by the day as its labor force shrank through aging, a declining birth rate, and out-migration to the larger metro areas for better work? Maybe I had one grocery store years ago. Maybe now it's gone. Maybe I can't get everything I would like to eat at the local dollar store and convenience store. But any calories are better than no calories. And so, I am grateful. The alternative is a long drive, spending gas money I may not have — especially now, thanks to our self-inflicted fuel crisis.
The questions this leaves
Where does this gravitational pull lead? Is it really a good strategy to let so much American land become uninhabitable over time as it loses its workers and the stores that rely on them to make their economics work? Should we really expect so many Americans to live off what they can buy at a dollar store? What right do any of us who don't have to live this way have to criticize the physical and mental health of those who do? And how can we ever expect the cost of health care to decline — Medicaid and all the rest — if we can't provide people with access to the healthy foods that USDA's economists blindly assume they can buy?
Those are just a few of the questions on my mind after studying this data. Feel free to add yours.
Tomorrow: the mirror image of the fuel-forward chain convenience store — the one chain format in structural decline, and the reason why.
Limits
Growth here means authorized stores. For super stores, supermarkets and dollar stores the distinction is small — those chains' authorization counts track their reported store counts almost exactly (see Day 2). For convenience stores a rising count can also mean wider EBT take-up among stores that already existed, so read its gradient as the shape, not the level.
Counties are classified by their current Rural-Urban Continuum Code (the 2023 vintage; Connecticut keeps its 2013 county codes because the 2023 file switched to planning regions). A county keeps one code across the whole window, so within-county comparisons are consistent — but "metro" means metro as defined today. 99.7% of active stores matched a coded county; the remainder sit in territories and a few renamed county-equivalents. County populations are the 2020 census.
A county is a coarse lens. A metro county contains poor neighborhoods far from any supermarket, and a rural county can have a town center with three grocers. The RUCC split measures the county's relationship to a metro area, not any single household's drive to a store.
Source: USDA FNS SNAP Retailer Locator Historical Data, 2005–2025. USDA ERS Rural-Urban Continuum Codes, 2023 (Connecticut: 2013), with 2020 census county populations. Analysis uses 656,868 stores with usable coordinates; a store counts as active in a year if an authorization covered 31 December. Code, pipeline and verification: Data4ThePeople/SNAP_Locations.
Support Data That Serves the Public
Data should empower people, not just institutions. Your support helps us create accessible research, visualizations, and tools that uncover economic inequality and inform better decisions.
Donate
Enjoying this post?
Tell others about it.
More articles like this
Fetching Related Posts
There are no other articles tagged with Data 4 Thought