
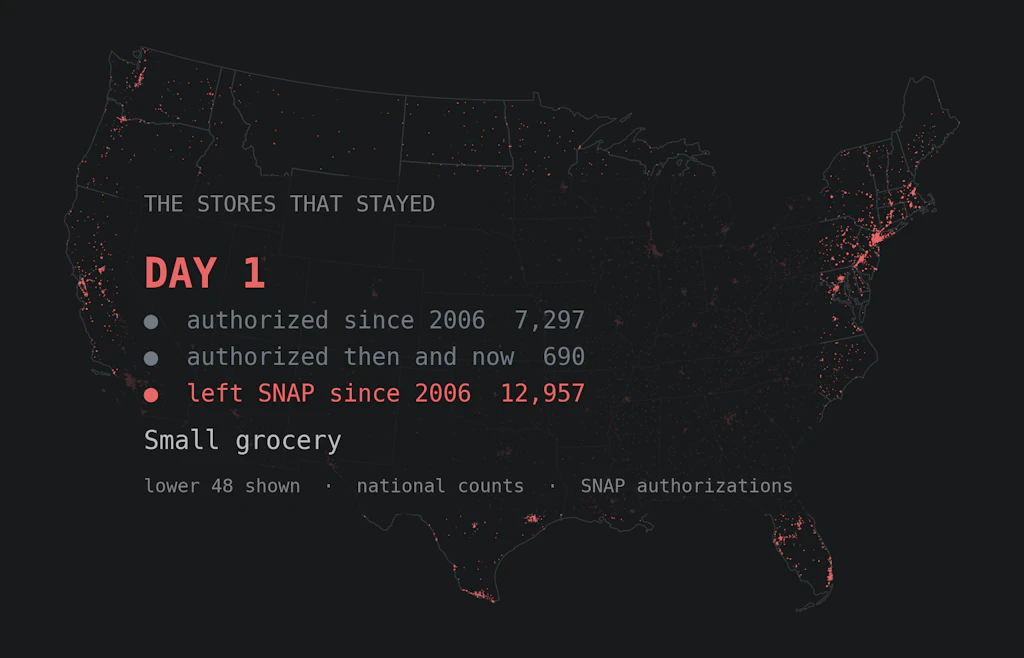
One in four of the smallest grocery stores is gone
SNAP-authorized retailers, 2006–2025, checked against Census County Business Patterns. 14,795 small grocery stores in 2012, 7,987 today.

Eric Pachman
Published
August 19th 2026
SNAP-authorized retailers, 2006–2025, checked against Census County Business Patterns. 14,795 small grocery stores in 2012, 7,987 today.
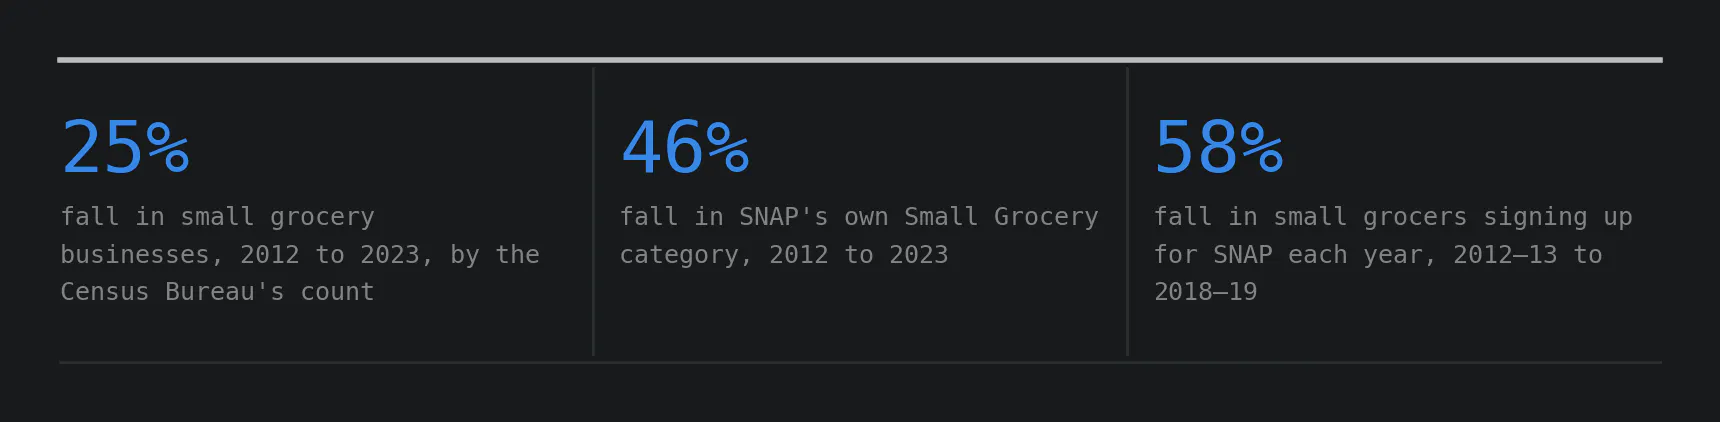
25% fall in the number of small grocery businesses, 2012 to 2023, by the Census Bureau's count. 46% fall in SNAP's own Small Grocery category, 2012 to 2023. 58% fall in the number of small grocers signing up for SNAP each year, 2012–13 to 2018–19.
Small grocery stores are leaving the SNAP program in large numbers. The obvious way to read that is that the neighborhood grocery store is dying. That turns out to be partly true, and the honest version is more useful than the headline.
How much of the drop is real
Start with what the SNAP records show. Stores authorized as small grocers peaked at 14,795 in 2012. They bottomed at 7,611 in 2020 and sit at 7,987 today.
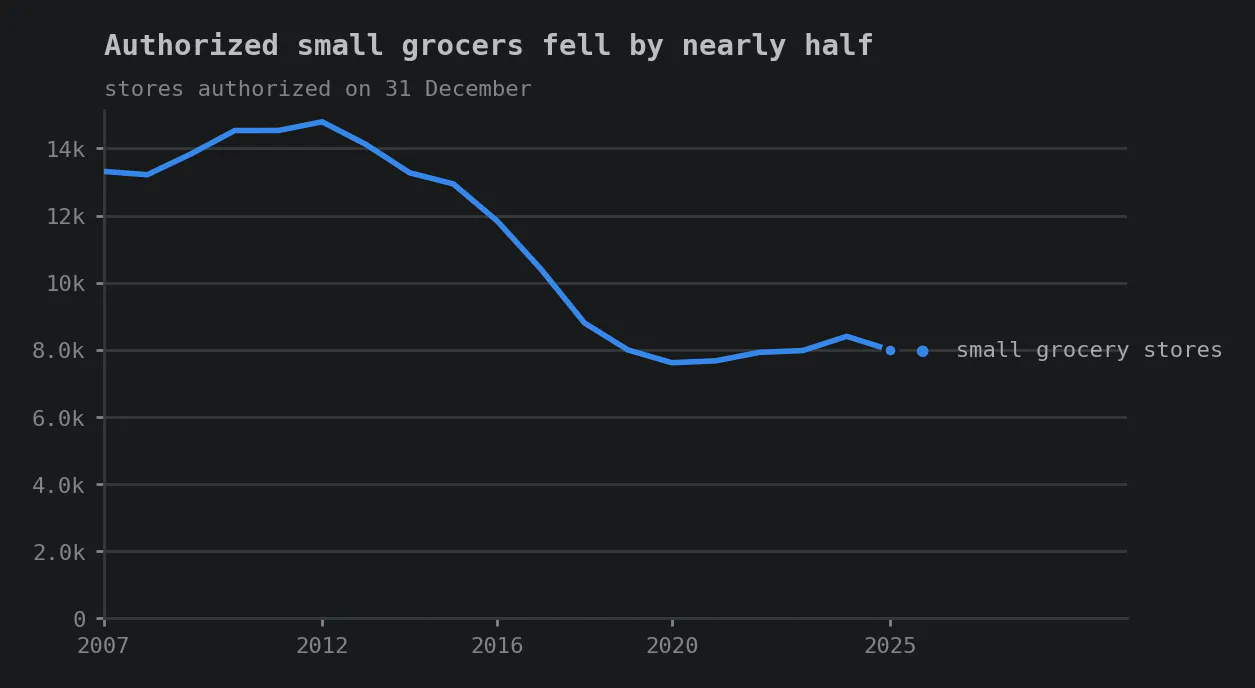
That is a fall of 46%. Before taking that number at face value, we checked it against a source that counts businesses instead of paperwork. The Census Bureau counts every grocery store with staff, whether or not it takes EBT.
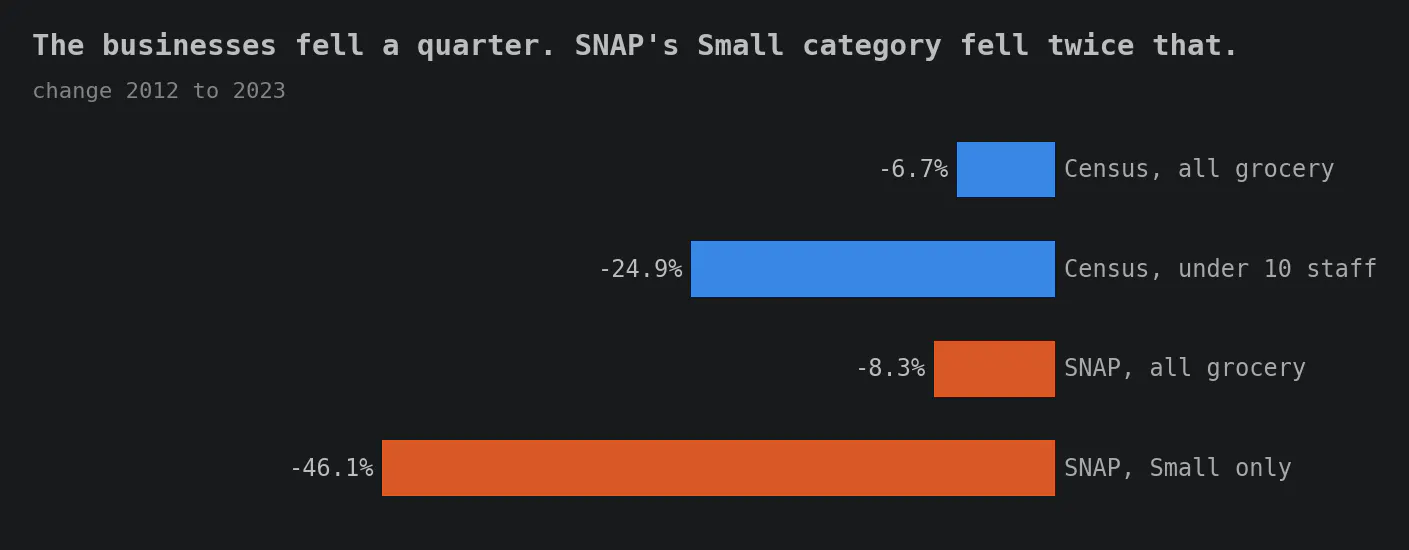
The census says small grocery businesses — those with under ten staff — fell 24.9%. Not 46%.
Why the two counts disagree, we can't say for certain. But here is what we do know.
First, the USDA only counts stores authorized to accept SNAP. The census counts stores. As we discussed yesterday, these are not the same. A store could drop SNAP if it became too onerous to maintain eligibility and still continue to operate.
Second, the size definitions are totally different. USDA defines a small grocer as one that "carries a small selection of all four staple food categories." The census categorizes stores by employee count. Different measures (one not even quantitative) would produce different results.
So, if we are trying to quantify the decline in small grocery stores, we'd use the census's data as a conservative estimate. But that is easy for us to write as we sit at our desks next to a fridge full of food. If you rely on SNAP, the 46% decline in small grocery stores is the real number.
It happened by stores not opening
The next question is how they went. If small grocers were being pushed out, we would expect a rise in the number of stores dropping their SNAP authorization. That is not what happened.
The decline was driven by the other side of the ledger: a steep fall in new grocers signing up to replace natural attrition. Sign-ups dropped from about 2,642 a year to 1,106 — a 58% decline in six years. The number of stores losing their authorization each year actually fell 20%. That paints a different picture — not incumbent grocers being shoved out of the market, but new small grocers no longer showing up to take their place.
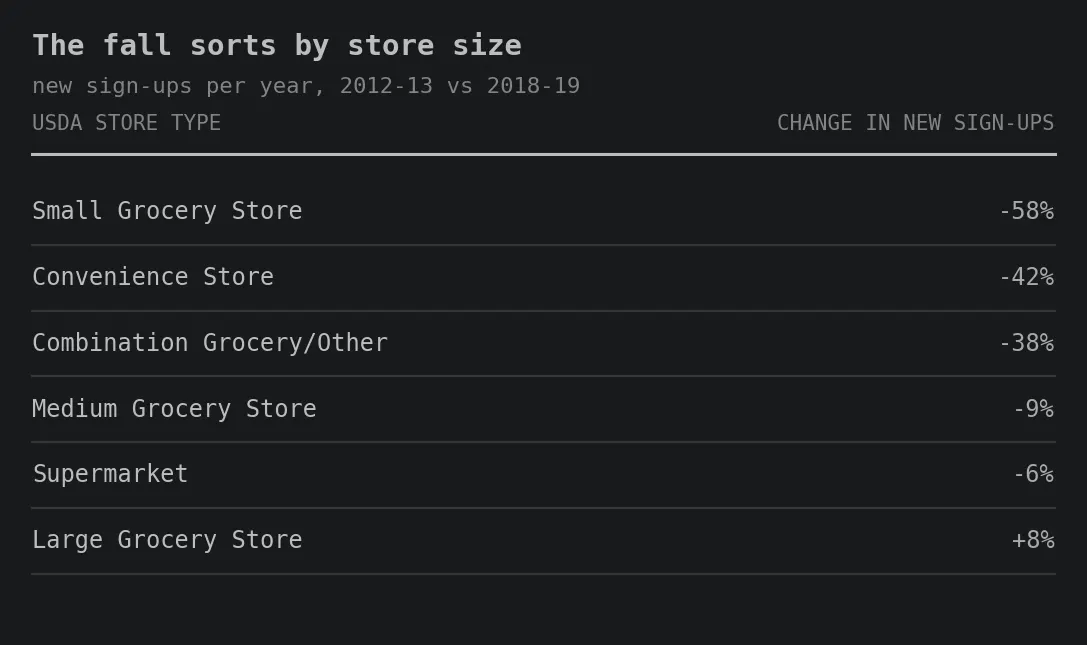
The small formats declined meaningfully. The larger ones dropped much less, and the largest grocery category actually grew. That is the shape a stocking requirement would produce: the rule asks for a fixed amount of inventory, which is a large demand on a small store and no demand at all on a big one.
While this would be a neat and tidy explanation for this table, sadly we can't prove it with the data we have. New sign-ups had been falling since 2012, years before the rule took effect, so something else is at work too. And these records carry no field for why an authorization ended. We can show the shape and the timing. We cannot show the reason.
It is not happening evenly
The decline is concentrated. New York lost more small grocers than any other state, by a wide margin.
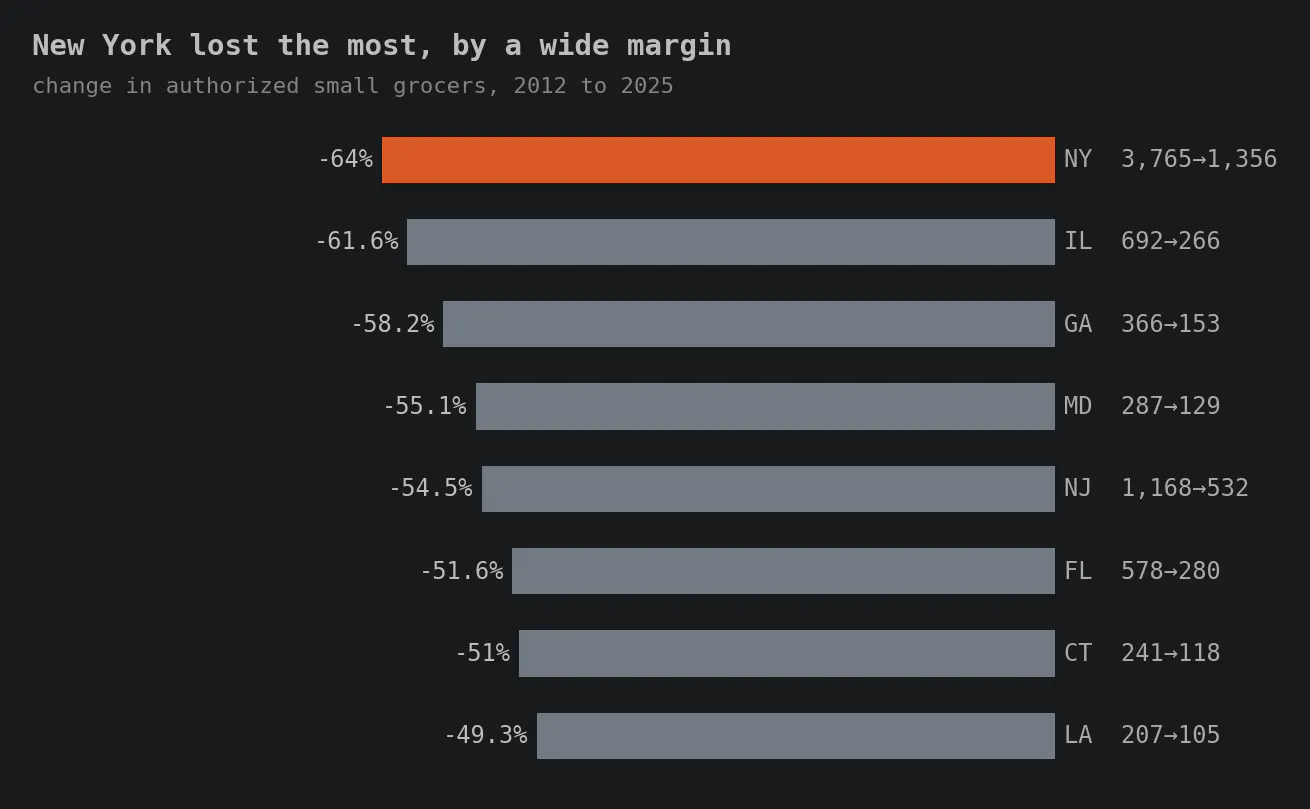
New York went from 3,765 to 1,356, a fall of 64%. Nearly all of that is New York City: the five boroughs (packed with bodegas and corner stores) held 3,200 of those stores in 2012 and account for 90% of the loss.
What it adds up to
No matter how you count it, the past decade has been hard on small grocery stores. SNAP's own records say the category fell 46%. The census says the businesses fell about a quarter. Either way, thousands of the smallest food stores in the country are gone, and almost none of the loss landed on the big ones.
The best explanation we have is a rule that was meant to help shoppers. Making every SNAP store keep 36 staple items in stock at all times means someone walking in with an EBT card finds real food on the shelf. That is a sensible aim. But it asks the same of a corner store as of a supermarket. A chain writes the shelf plan once and spreads the cost over thousands of stores. A single shop pays it alone, in cash tied up in stock and food that may spoil. We cannot prove that is what happened. The timing and the shape both fit.
There is another small format worth looking at before drawing any conclusions. A dollar store is a small box too: narrow range, few staff, cheap to run. Everything a small grocer is. Did it meet the same fate? Or did it find a way to thrive in a system that rewards size?
Tomorrow: the dollar store.
Limits
"Left SNAP" is the strongest claim these records support. A store that closes and a store that stays open but stops taking EBT look identical here. That is why the census check matters, and why the headline number is the census one.
Some stores do drop out and come back: 6.0% of small grocers lost their authorization and later regained it, with a median gap of 58 days. Those stores were plainly open the whole time.
The Census Bureau counts businesses with paid employees. A grocery store run entirely by its owner with no payroll is not in that count, so the comparison covers employer businesses only.
One category is left out of that table. New Super Store authorizations also fell, by 36%, and most of that is Walmart — from about 168 a year to 10 — pausing a supercenter program that was already close to complete. A store that size meets any stocking requirement without trying, so the rule cannot be what moved it.
The stocking rule is offered as a likely explanation, on timing and shape. These records carry no reason code, so this source alone cannot confirm it.
Source: USDA FNS SNAP Retailer Locator Historical Data, 2005–2025, and Census County Business Patterns, NAICS 445110. Analysis uses 656,868 stores with usable coordinates; a store counts as active in a year if an authorization covered 31 December. Entries and exits count stores, not authorization spells, so a store that lapsed and resumed is not double-counted. Code, pipeline and verification: Data4ThePeople/SNAP_Locations.
Support Data That Serves the Public
Data should empower people, not just institutions. Your support helps us create accessible research, visualizations, and tools that uncover economic inequality and inform better decisions.
Donate
Enjoying this post?
Tell others about it.
More articles like this
Fetching Related Posts
There are no other articles tagged with Data 4 Thought