

She carried the jobs recovery
The more our job growth runs on health care, the more our workforce tilts toward women. Here's the data.

Eric Pachman
Published
July 9th 2026
The New Rosie Wears Scrubs
Two days ago we showed you that health care and social assistance drove almost 89 percent of the nation's payroll job growth since the end of 2023. That number came from the Bureau of Labor Statistics employer survey, called the CES. Then we published what may be the most complete tool anywhere for tracking the BLBS population survey, called the CPS, over time. Today we try to connect the two. We have one question in mind: are men or women driving the growth in America's working population?
Women drove 60 percent of the growth
From December 2023 to December 2025, the number of employed Americans grew by nearly 3 million. Women accounted for about 60 percent of that gain.
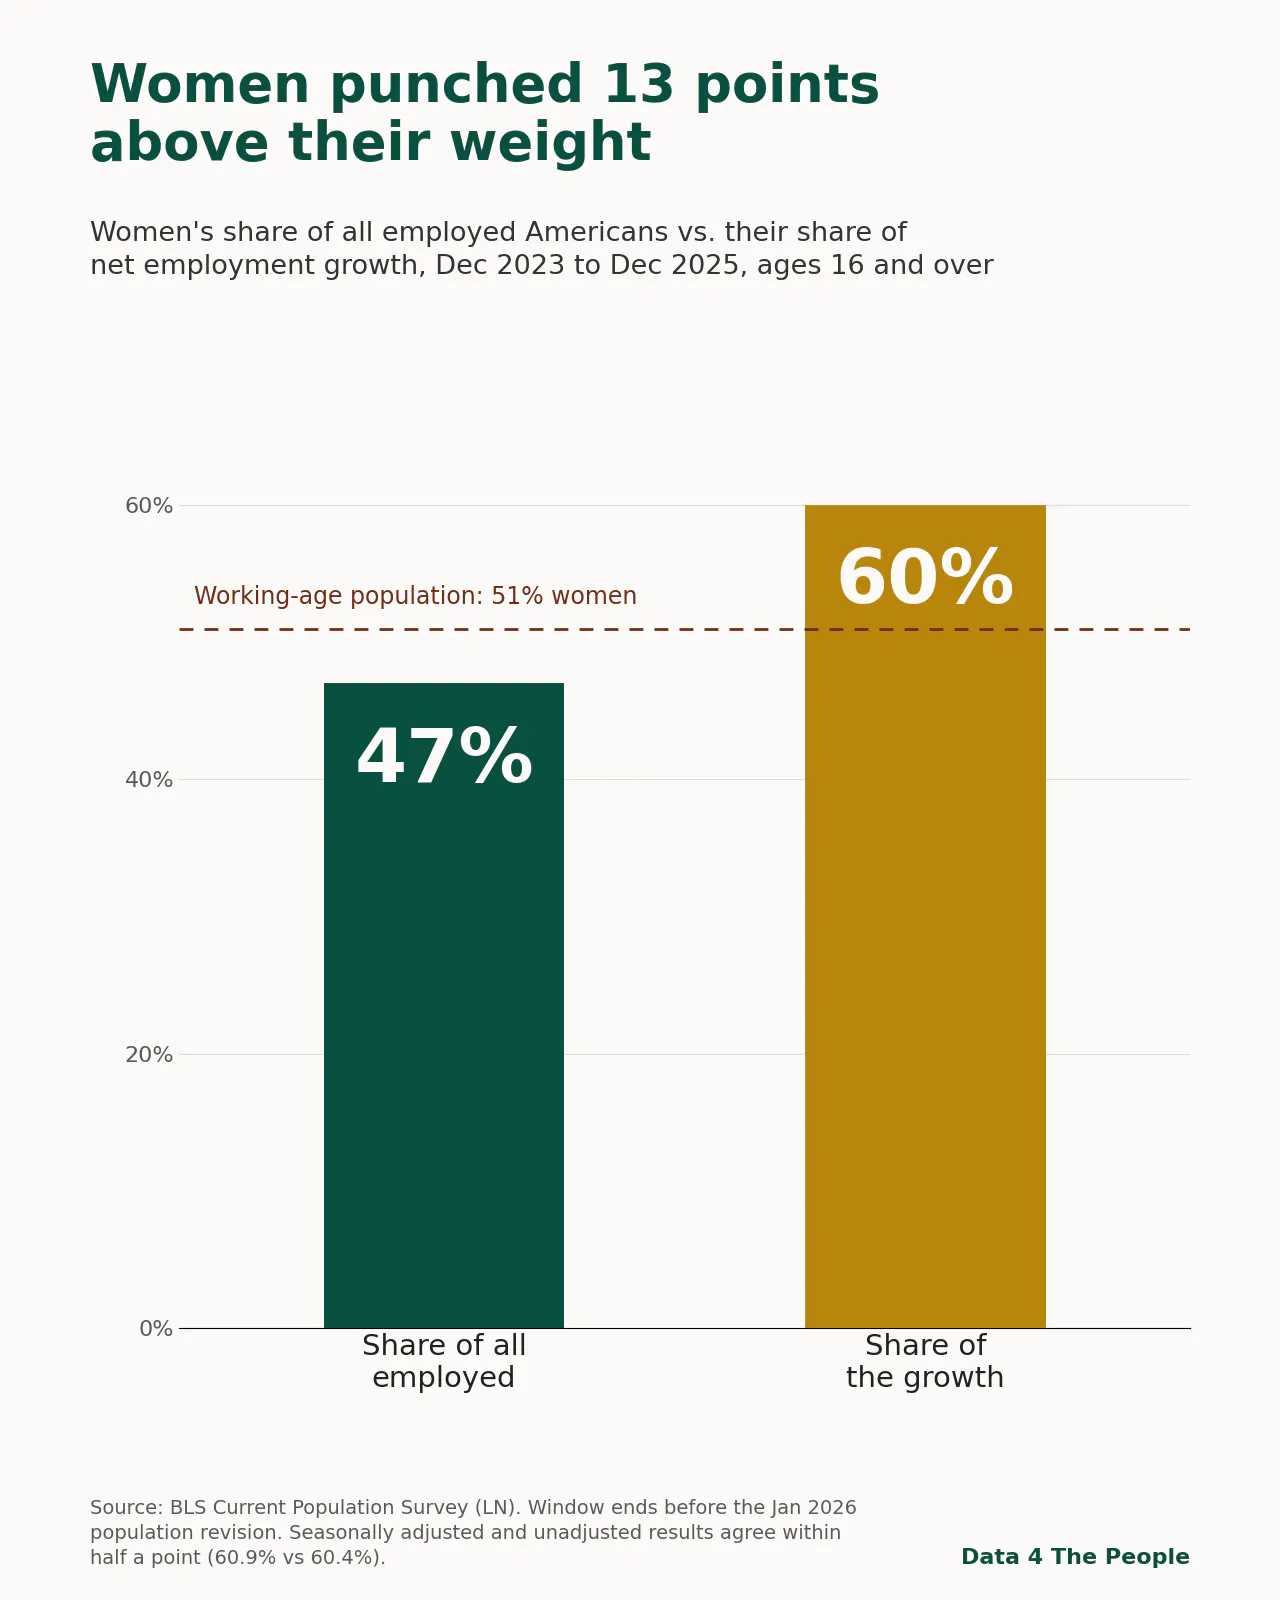
We measured this with the Current Population Survey, the monthly household survey behind the unemployment rate. Unlike the payroll survey, the CPS counts people, not positions, and it can split them by sex. Over those two years, the number of women with jobs rose by about 1.8 million. The number of men with jobs rose by about 1.2 million.
We checked this two ways. The seasonally adjusted data says women were 60.9 percent of the growth. The raw data, measured December to December so the seasons cancel out on their own, says 60.4 percent. When two different methods land within half a point of each other, you are looking at something real.
Here's the honest context. Women are about 51 percent of working-age adults and about 47 percent of everyone with a job. But they took about 60 percent of the growth. That is roughly 13 points more than their share of jobs would predict. It's not a complete takeover. But it's a real and meaningful shift toward team ♀.
Since then, too shaky to call. But watch it.
Why stop the clock at December 2025? Because of what happened next. Every year the government updates its estimate of how many people live in the country. In January 2026, that update was a big one. It went back to the 2020 Census count and added new, lower numbers for how many people moved to the United States from abroad.
Here's why that matters. The survey asks about 60,000 households and then scales the answers up to the whole country. So when the government revises how many people it thinks exist, the job count moves too, even though nobody's job actually changed. The 2026 update lowered the estimated number of men, mostly men ages 25 to 54, and raised the estimated number of women.
That one change cut the measured count of employed men by about 1.6 million in a single month. If you pull the raw 2026 data yourself, you will see what looks like a huge drop in men's employment. Those men did not lose their jobs. The government's estimate of how many men exist just got smaller. This is the same January update that redrew the country's racial makeup in the data, the one we wrote about when the multiracial count jumped. It redrew sex too. Our two-year window stops at December 2025 on purpose, so none of this touches the 60 percent.
For the months after, we compared June 2026 to June 2025. Same month, one year apart, so the seasons cancel. Then we removed the population update using the method BLS itself recommends. After that, the past year of job growth comes to about a quarter of a million people. On a base of about 164 million workers, that rounds to zero. It is too small to tell apart from no change at all.
Inside that flat year, women's employment inched up and men's edged down. But both moves are small enough to be survey noise. So we will not put a share on a number that rounds to nothing.
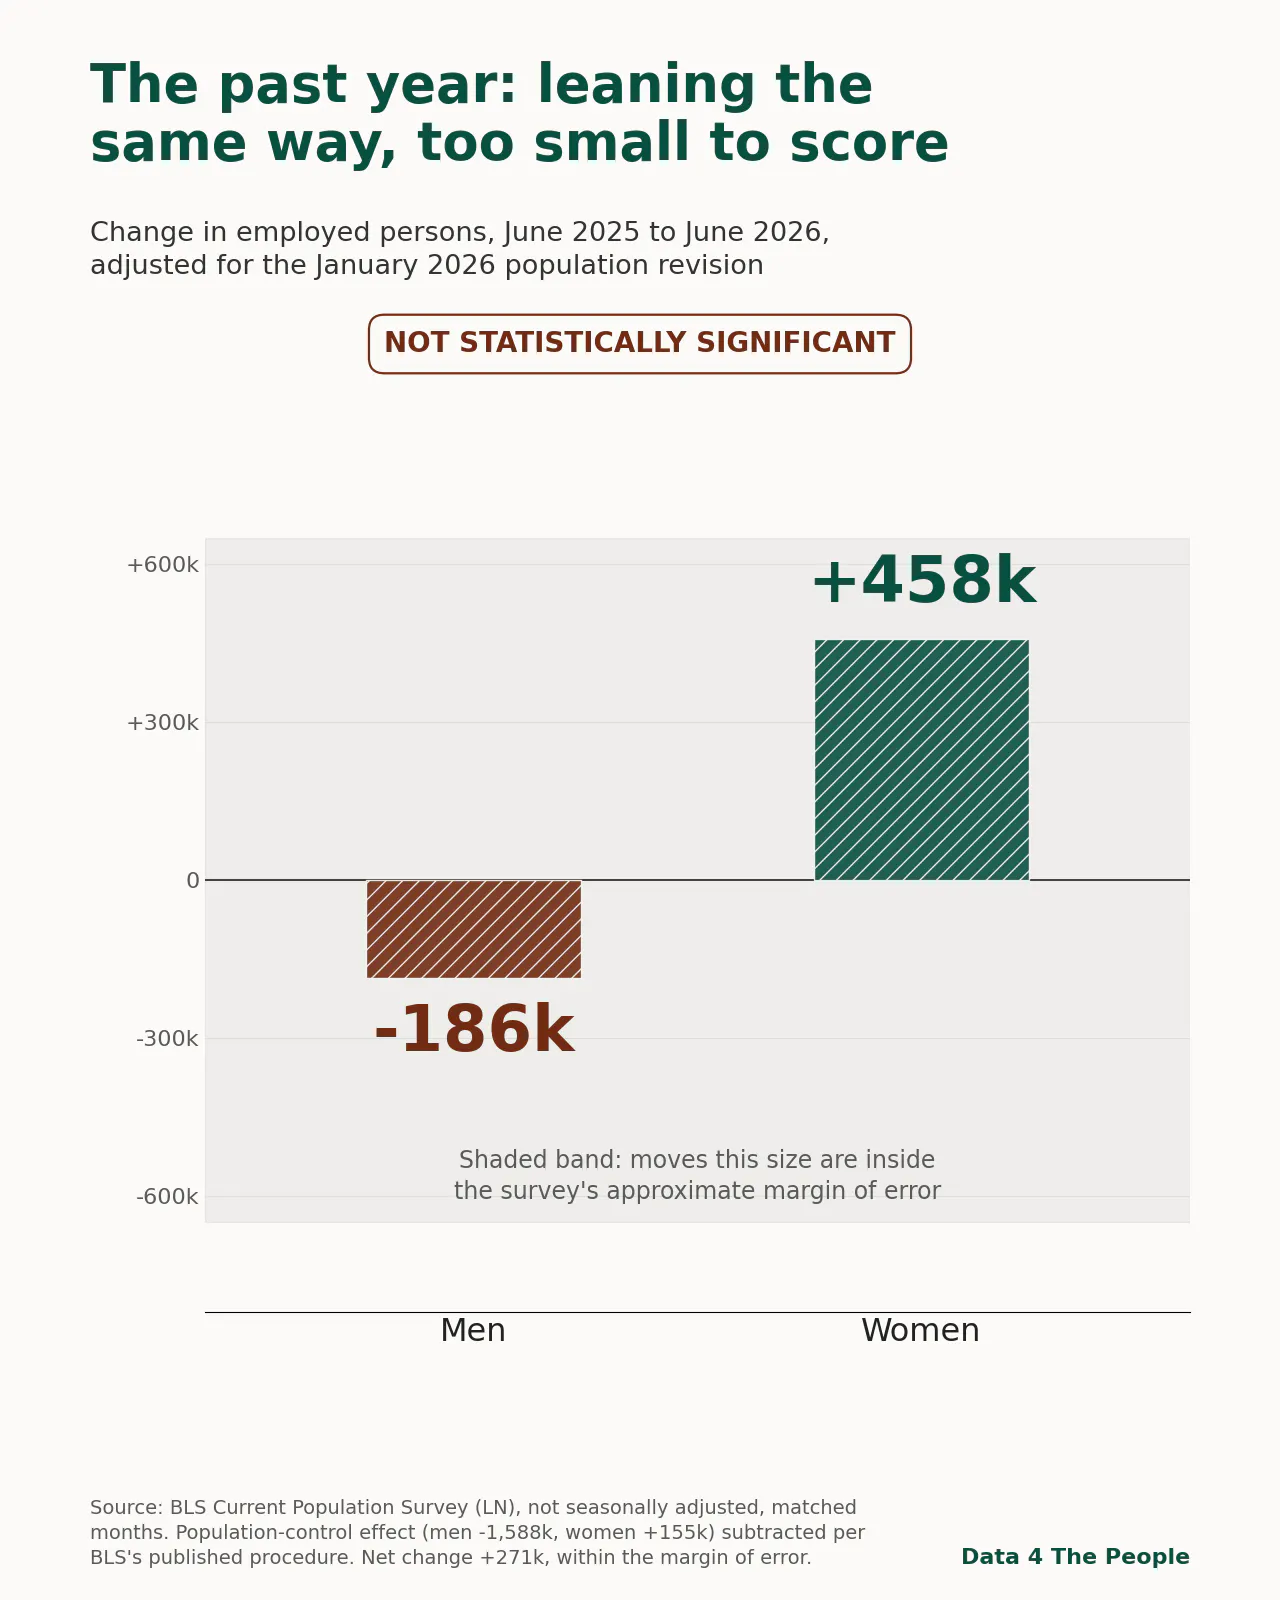
Here's what we will say. The recent data can't confirm the pattern, but it keeps leaning the same way. We have our eyes on it, and not just here. The participation data has been hinting at something for months, and that story is next.
Why we expect the lean to continue
Here is where we play detective. We are not claiming a proven cause or the whole truth. We are lining up three clues and reading where they point.
Clue one: health care and social assistance drove almost 89 percent of the nation's payroll job growth since the end of 2023, and maybe more once the next revision lands.
Clue two: from our CPS Monthly Explorer, about 78 percent of the people who work in that industry are women.
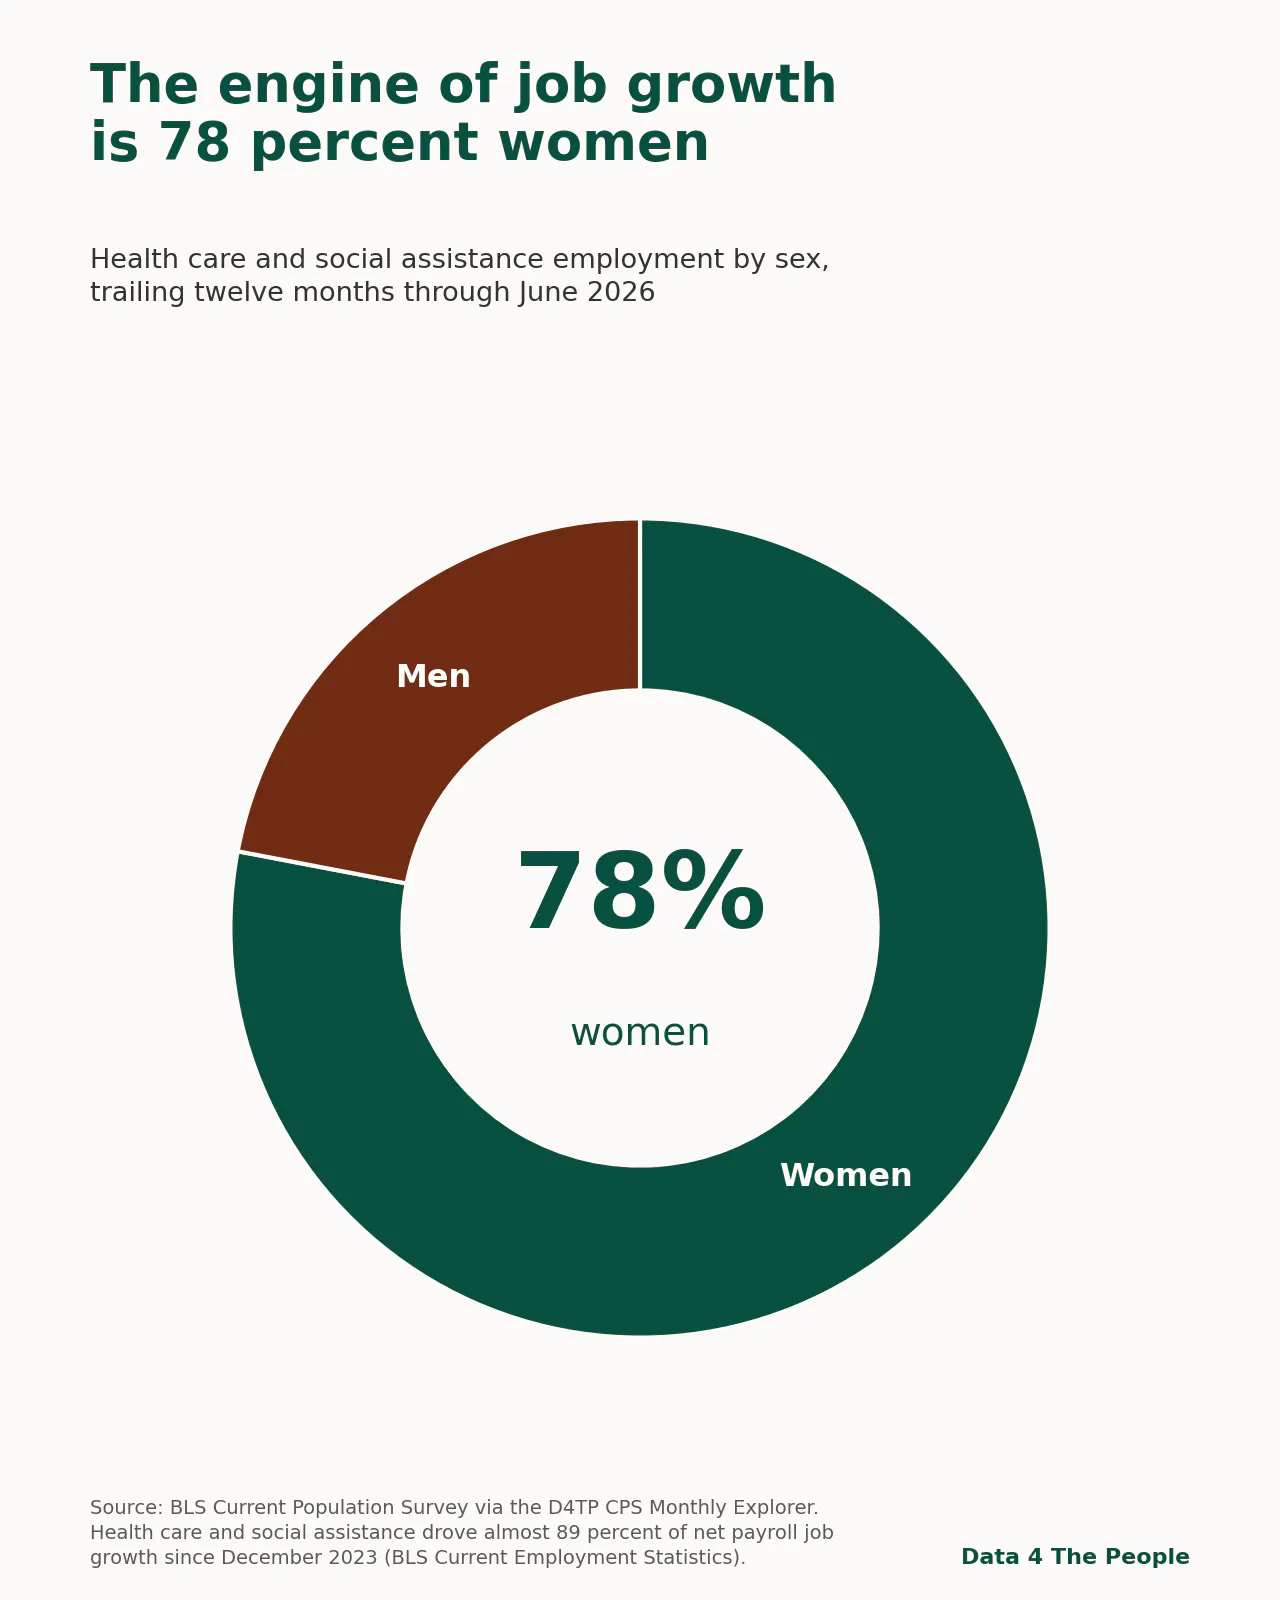
Clue three: as we covered above, women were about 60 percent of the growth in employed Americans over the same two years.
No single survey ties all three of those facts together on one record, and we won't pretend otherwise. The payroll survey can't see sex. The household survey only breaks industry down by sex in groups too broad to prove the link.
But we are data detectives, and detectives follow clues to solve a puzzle. These clues are hard to argue with. If most of the country's job growth comes from an industry where about four in five workers are women, and if new hires look anything like the workers already there, then the working population going forward is likely to become even more reliant on women.
Methodology notes
Source. All figures come from the BLS Current Population Survey (LN database), pulled from the complete flat files, except the payroll growth concentration figure, which comes from the BLS Current Employment Statistics survey. Headline CPS series: employed persons, 16 years and over, seasonally adjusted (LNS12000000, LNS12000001, LNS12000002) and not seasonally adjusted (LNU02000000, LNU02000001, LNU02000002).
The two-year window. Growth is measured December 2023 to December 2025, ending before the January 2026 population-control revision. Matched December endpoints cancel seasonal patterns in the unadjusted data. Seasonally adjusted and unadjusted results agree within half a percentage point (60.9 versus 60.4 percent).
The twelve-month reading. June 2025 to June 2026, not seasonally adjusted, matched months. Because this window crosses the January 2026 revision, we subtracted the published population-control effect on employment (total minus 1,432,000; men minus 1,588,000; women plus 155,000) following the procedure BLS describes in the February 2026 Employment Situation release. The resulting net change of roughly plus 271,000 is within the survey's margin of error, so we describe the period as flat and do not compute shares of it.
The January 2026 revision. With February 2026 data, BLS incorporated updated Census population estimates that reverted to the April 2020 Census base and reflected lower net international migration. Per BLS, the update decreased the population level for men, mostly ages 25 to 54, and increased it for women, particularly 65 and over. Official data for December 2025 and earlier were not revised, which is why comparisons across the seam are distorted and why we segment at it.
Triangulation, stated plainly. The 89 percent payroll concentration figure and the by-sex employment figures come from two different surveys with different definitions. The 78 percent female share of health care and social assistance comes from the CPS. No single dataset connects industry, sex, and growth on one record at this level of detail. Our concluding expectation is probabilistic, not demonstrated.
Persons, not jobs. The CPS counts employed people, including the self-employed, and nets hires against exits. It does not count jobs. The phrase "net increase in employed Americans" is used deliberately throughout.
Support Data That Serves the Public
Data should empower people, not just institutions. Your support helps us create accessible research, visualizations, and tools that uncover economic inequality and inform better decisions.
Donate
Enjoying this post?
Tell others about it.
More articles like this
Fetching Related Posts
There are no other articles tagged with Data 4 Thought