
The PPI Scuba Diver: five takeaways from September 2026
Wholesale prices rose 6.3% in the 12 months to September 2026, the most since December 2022. Here are five things we found when we took the diver down to look.

Eric Pachman
Published
October 20th 2026
Yesterday we released the PPI Scuba Diver, a free animated chart of every item in the Producer Price Index for final demand. Today we use it to look at the September 2026 data, which the Bureau of Labor Statistics (BLS) released on October 15, 2026.
The Producer Price Index (PPI) measures the prices U.S. businesses receive for what they sell. It is often called wholesale inflation. In the 12 months to September 2026, PPI final demand rose 6.3%. That is the largest 12-month increase since December 2022, up from 3.4% in the 12 months to February 2026.
Here are five findings that grabbed our attention. The diver itself is at the end of the post, so you can explore the data yourself.
Note: BLS revises PPI data for four months after it first publishes it. The figures for June to September 2026 are preliminary, so every September number in this post may change.
1. Wholesale prices rose 6.3%, the most since December 2022
The chart below shows the 12-month change in PPI final demand every month since October 2016. The bars split each month into goods, services and construction.
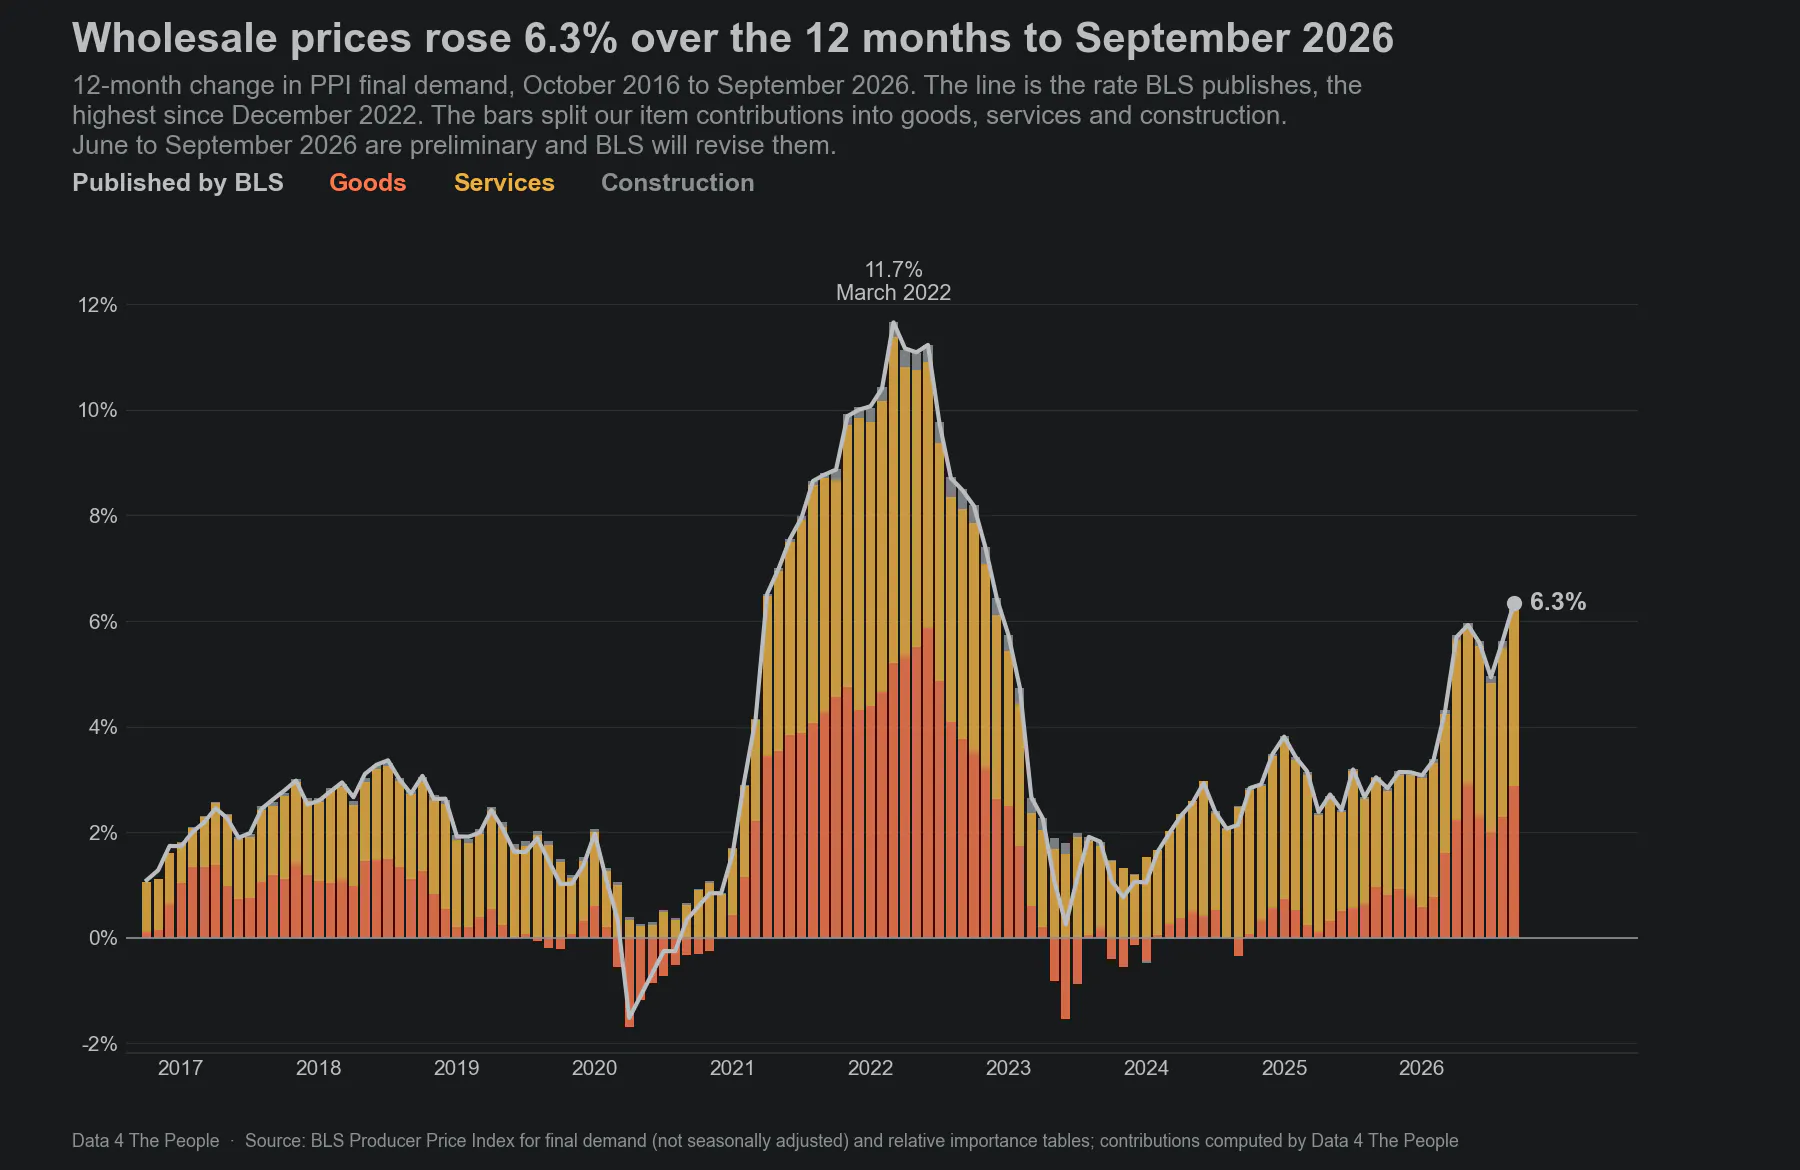
12-month change in PPI final demand, not seasonally adjusted. Bars are the sum of our item contributions for goods, services and construction. Source: BLS; contributions computed by Data 4 The People.
The rate was 3.0% in September 2025 and 3.4% in February 2026. It then rose to 4.3% in March and 5.7% in April, dipped to 4.9% in July, and reached 6.3% in September. The peak in these 10 years was 11.7% in March 2022.
Services added 3.33 points of the rise, or 53%. Goods added 2.88 points, or 45%. Construction added 0.14 points, or 2%.
Of the 823 items in September, 686 added to the 12-month change and 99 took away from it.
2. Fuels made up about 30% of the rise
The chart below starts at zero and adds the eight items that pushed the 12-month change up the most, then the other 811 items together, then the four items that pulled it down the most.
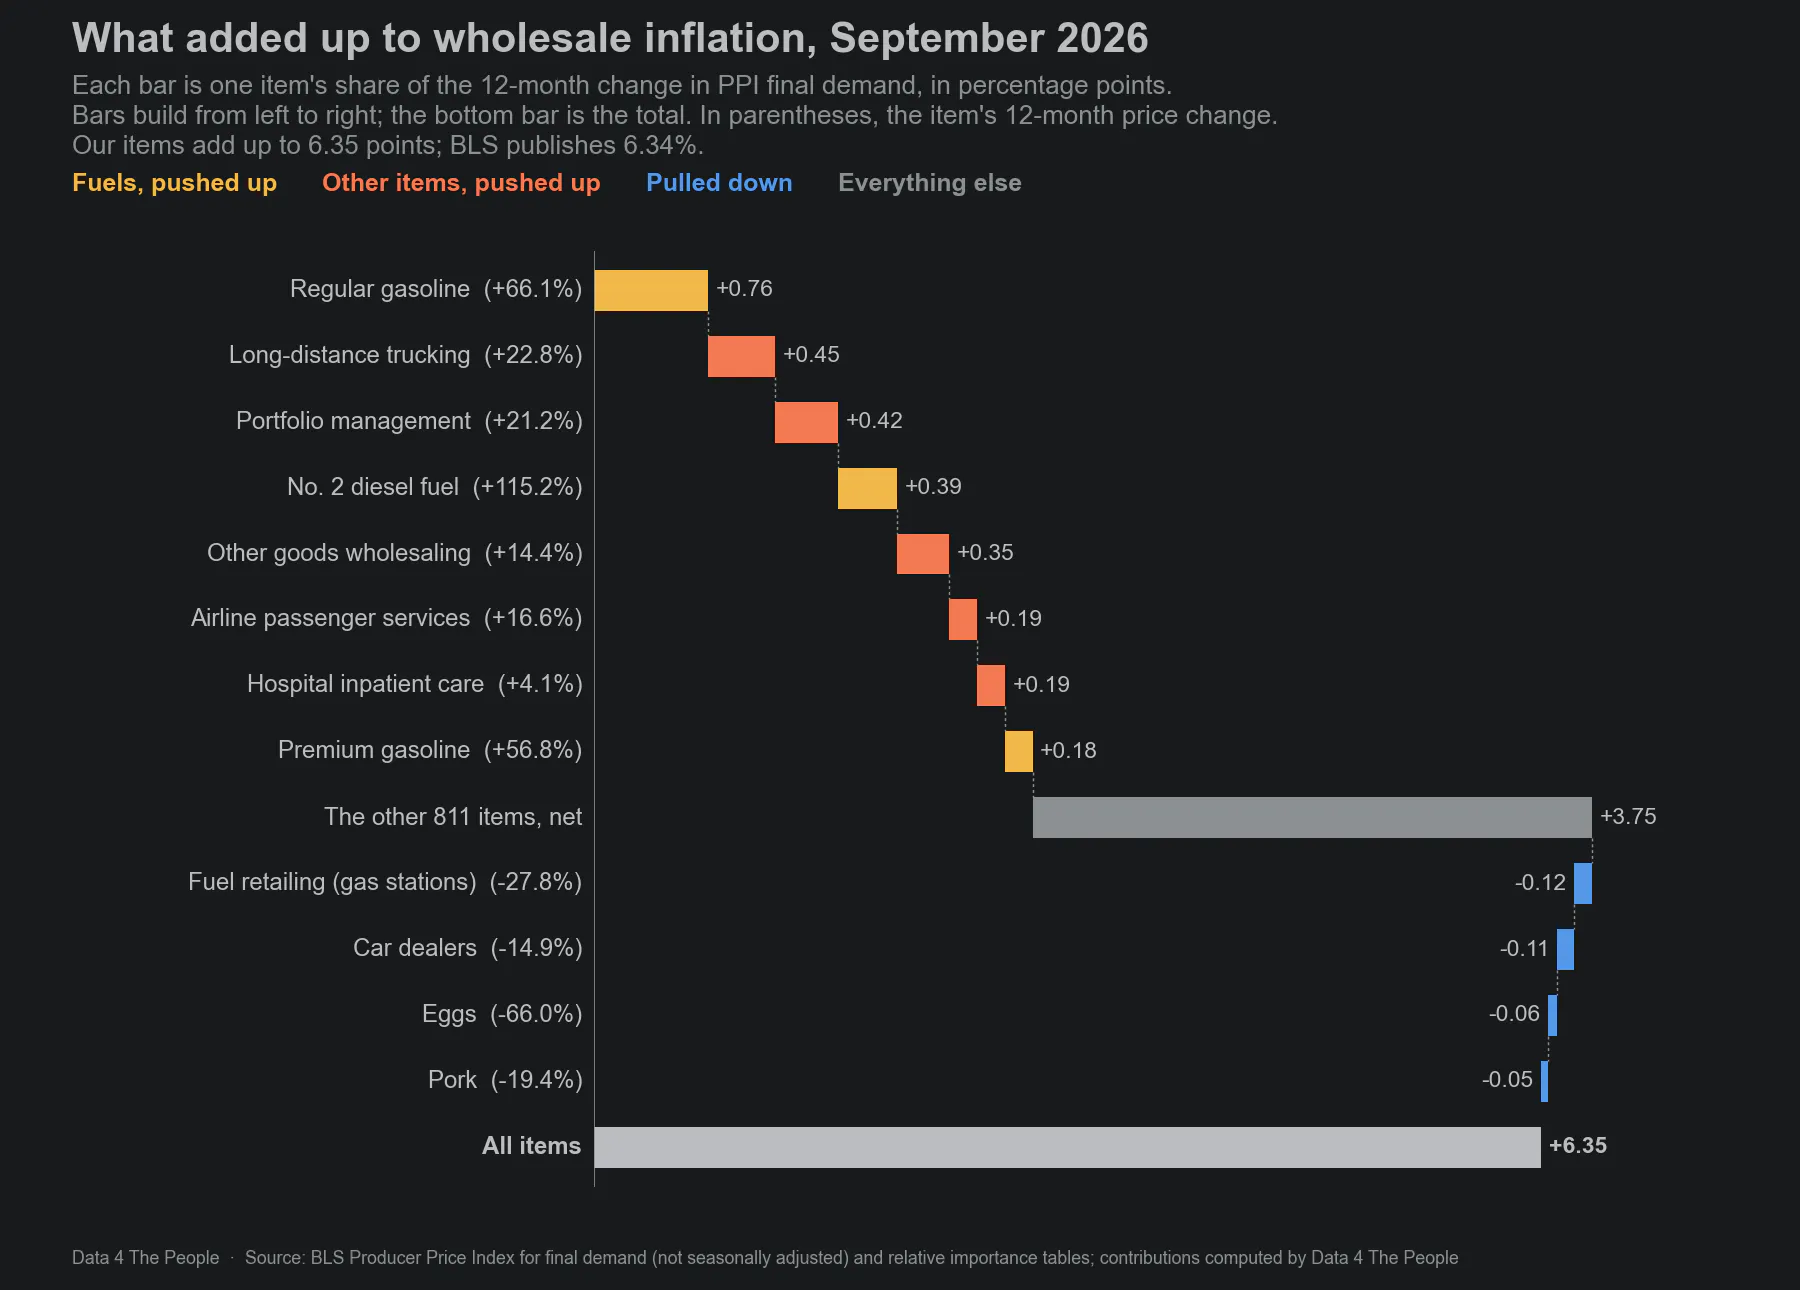
Each bar is the item's contribution to the 12-month change in PPI final demand, in percentage points. Our items add up to 6.35 points; BLS publishes 6.34%. Source: BLS; contributions computed by Data 4 The People.
Regular gasoline added the most, 0.76 points. Its price was 66.1% higher than a year earlier. Regular gasoline is about 1.2% of final demand by weight, but it added 12% of the rise.
Diesel fuel came next among fuels. Its price rose 115.2%, the largest 12-month increase since June 2021, and it added 0.39 points.
Taken together, the fuels and power group, which includes gasoline, diesel, jet fuel, heating oil, electricity and natural gas, added 1.93 points. That is 30% of the 6.35 points our items add up to. For context, the group is just 5.4% of final demand by weight.
3. Long-distance trucking rose the most since 2022
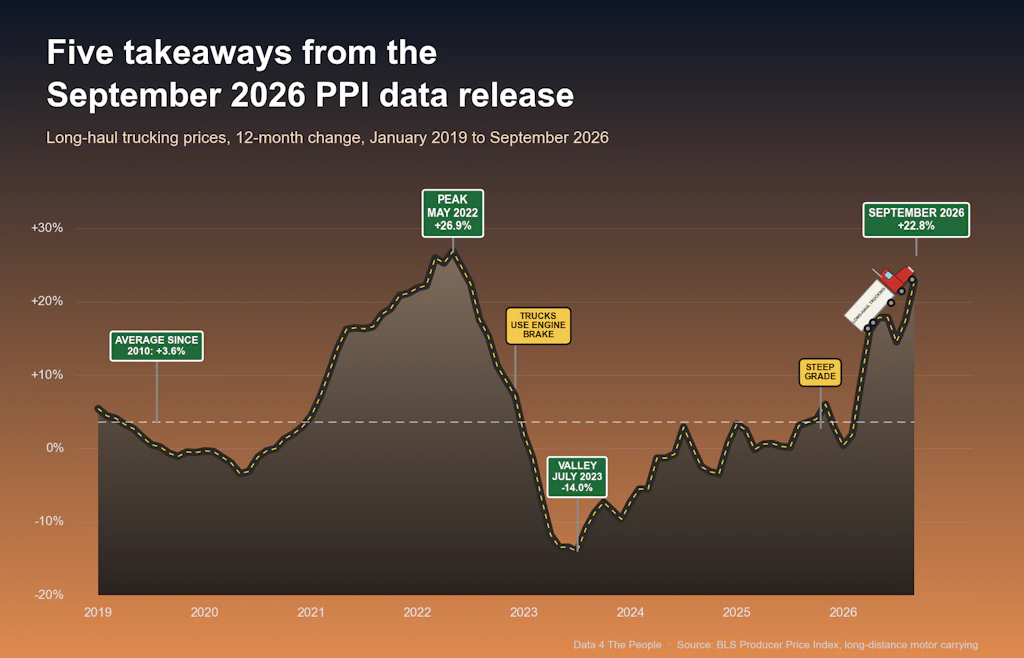
Long-distance trucking added 0.45 points, the second-largest addition of any item, after regular gasoline. Its price rose 22.8% over the 12 months to September 2026.
To see how unusual that is, the chart below goes back further than the diver, to June 2010, the first 12-month change available since BLS began publishing this index in June 2009. The dashed line is the average of every month before September 2026.
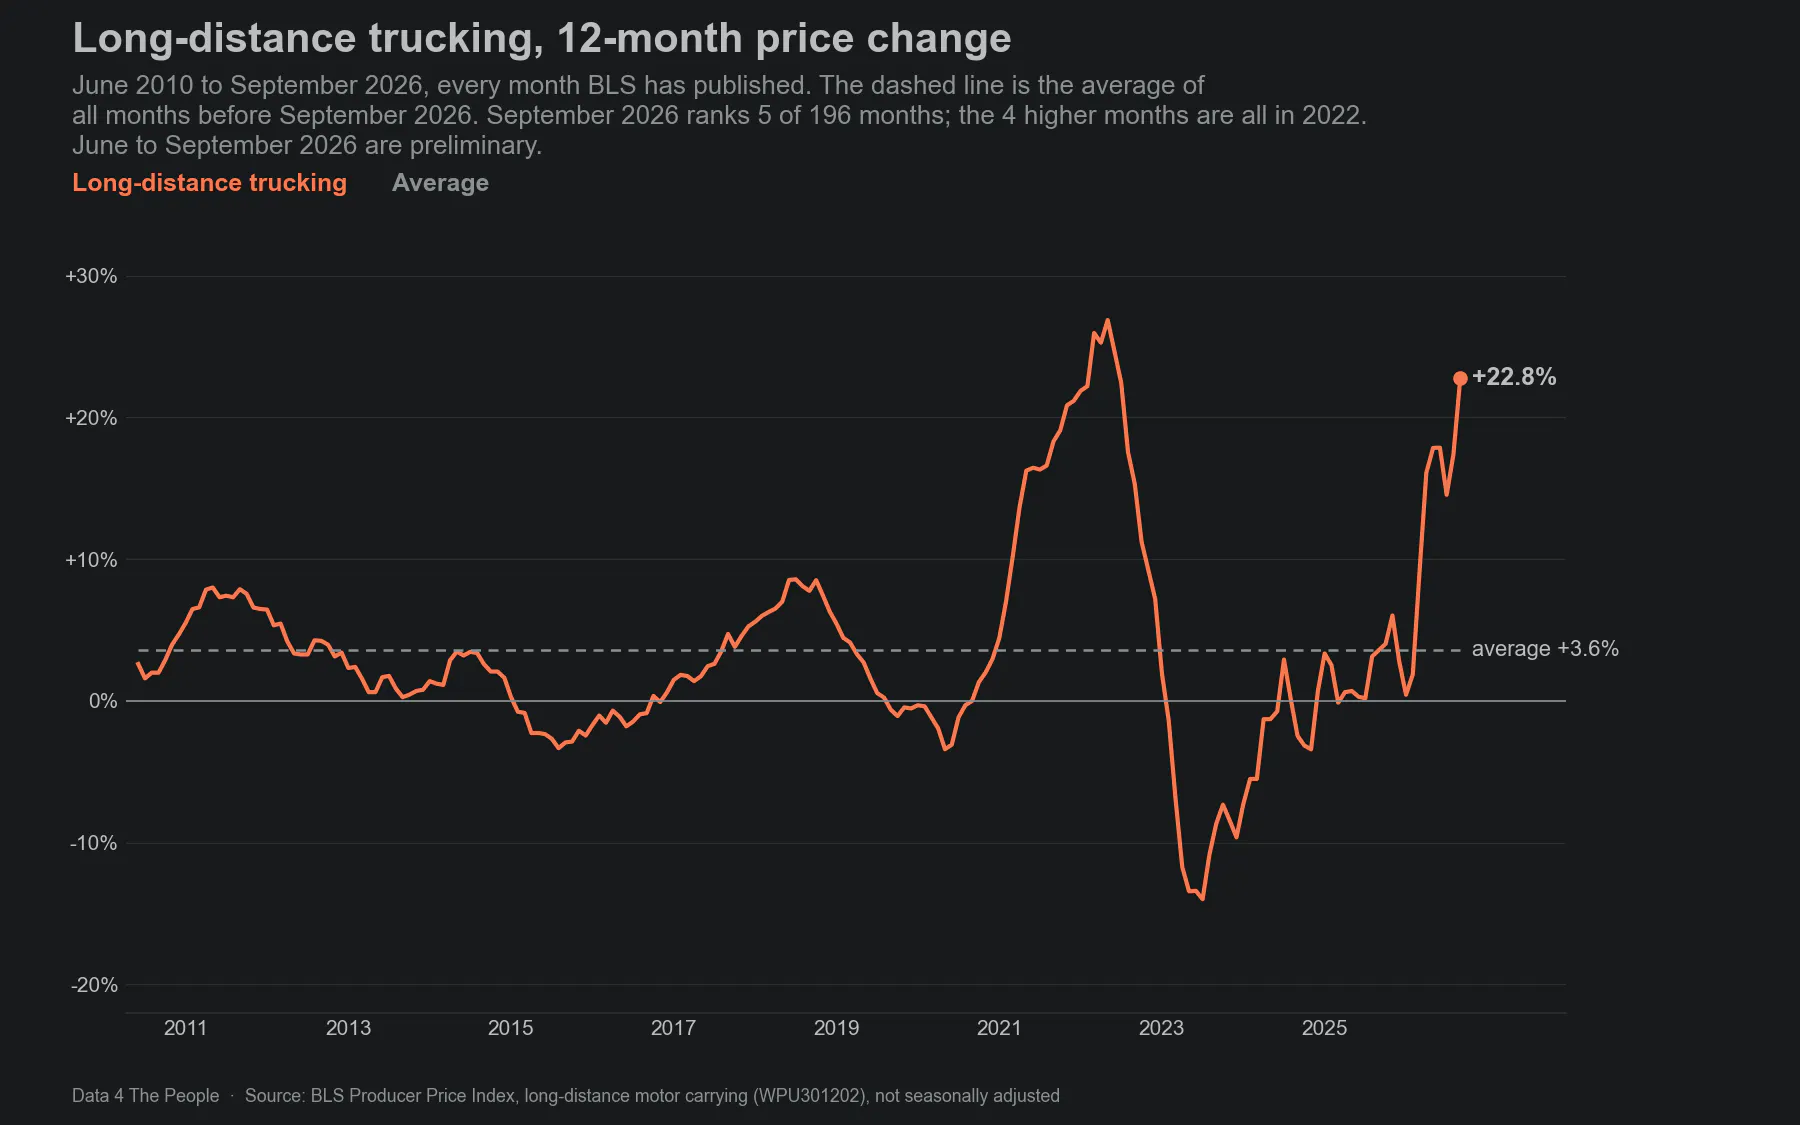
12-month price change in long-distance motor carrying, every month BLS has published. The dashed line is the average of all months before September 2026. June to September 2026 are preliminary. Source: BLS.
September 2026 ranks fifth of the 196 months. The only higher months are March to June 2022, when the rate peaked at 26.9%. The average before this month was 3.6%.
The rise came quickly. The rate was 0.4% in January 2026 and 1.9% in February. It reached 9.2% in March and 16.1% in April, and stayed between 14.5% and 17.9% from May to August.
Over the same 12 months, the price of diesel fuel rose 115.2%. Much of the freight that moves under contract carries a fuel surcharge that is reset each week from the diesel price, and BLS has noted that its transportation price indexes follow those surcharges up and down. Our Diesel Fuel Surcharge Calculator shows how a diesel price becomes a surcharge on a truckload, LTL or rail bill.
4. Jet fuel more than doubled
The chart below shows the 12-month change in the price of jet fuel since October 2016, along with airline fares, which is what travelers pay, from the Consumer Price Index (CPI).
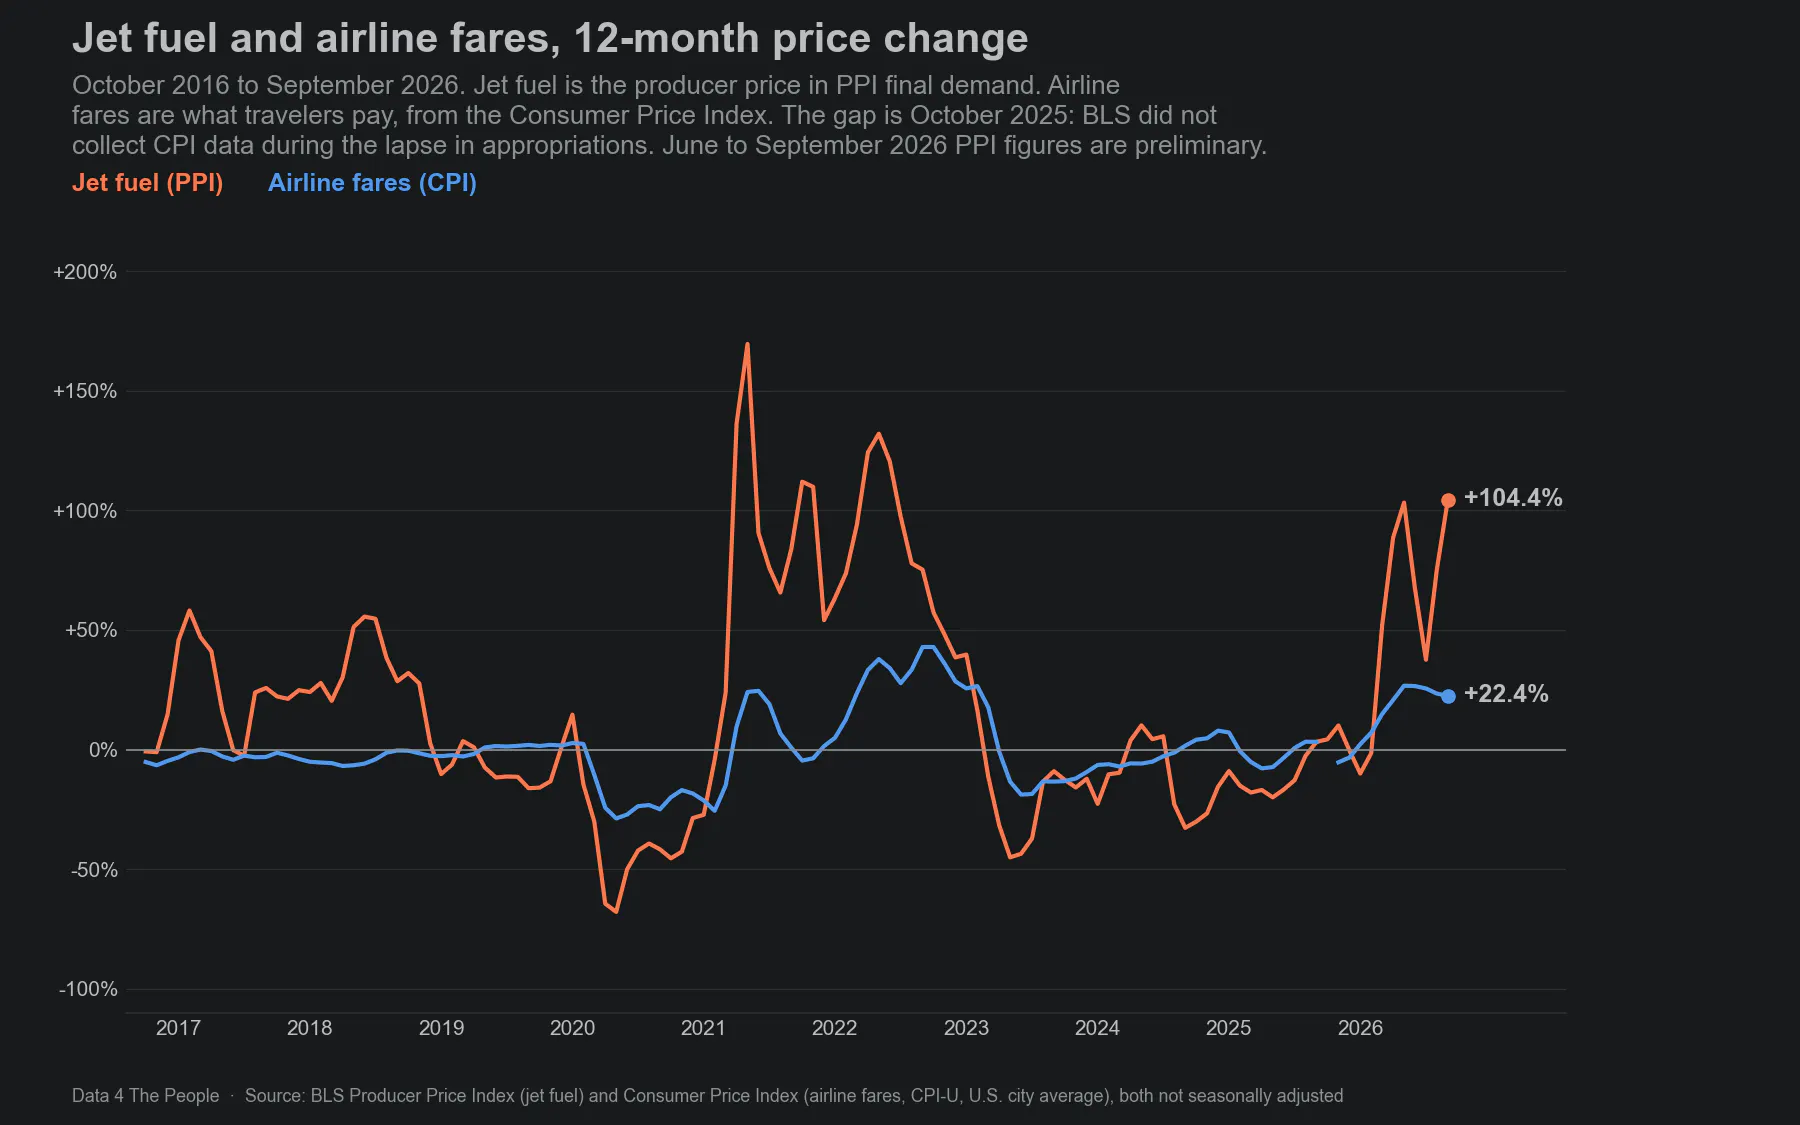
12-month price change. Jet fuel is from PPI final demand; June to September 2026 are preliminary. Airline fares are from the CPI for All Urban Consumers, U.S. city average; BLS did not collect CPI data for October 2025. Both not seasonally adjusted. Source: BLS.
Jet fuel prices were 104.4% higher in September 2026 than a year earlier. A year before that, in September 2025, they were up 3.2%. The last time jet fuel rose faster over 12 months was June 2022, when it was up 120.5%.
Airline fares in the CPI were 22.4% higher than a year earlier. In 2022, fares peaked at 42.9% in September, while jet fuel peaked at 132.1% in May.
The two lines tend to rise and fall in the same years, with fares moving in a much narrower range.
Fuel is one of an airline's largest costs, and its share grows when fuel prices rise. On U.S. airlines' domestic flights, fuel was 21.7% of operating expenses in the second quarter of 2026, up from 15.0% a year earlier, according to the Bureau of Transportation Statistics. On their international flights, it was 31.1%, up from 20.9%. Worldwide, the International Air Transport Association (IATA) expects fuel to make up 31.4% of airline operating costs in 2026, up from 25.4% in 2025.
IATA also says that North American airlines have largely stopped hedging their fuel costs, so changes in the price of jet fuel reach their costs more directly and quickly. It reports that fares are rising as airlines try to recover some of the higher cost, but that "airlines are still absorbing part of the hike in their bottom lines."
5. Portfolio management fees rose 21.2%
Portfolio management rose 21.2% and added 0.42 points, the third-largest addition of any item.
BLS prices portfolio management mostly from the fees firms charge as a share of the assets they manage. It holds each portfolio's assets fixed at the start of the period and updates their value by the portfolio's return. When the value of those assets rises, the fee rises with it, even if the fee rate stays the same.
So the chart below compares the index with the stock market. The blue line is the S&P 500's 12-month change to the end of the month before. Over these 10 years, a one-month shift is where the two lines match most closely.
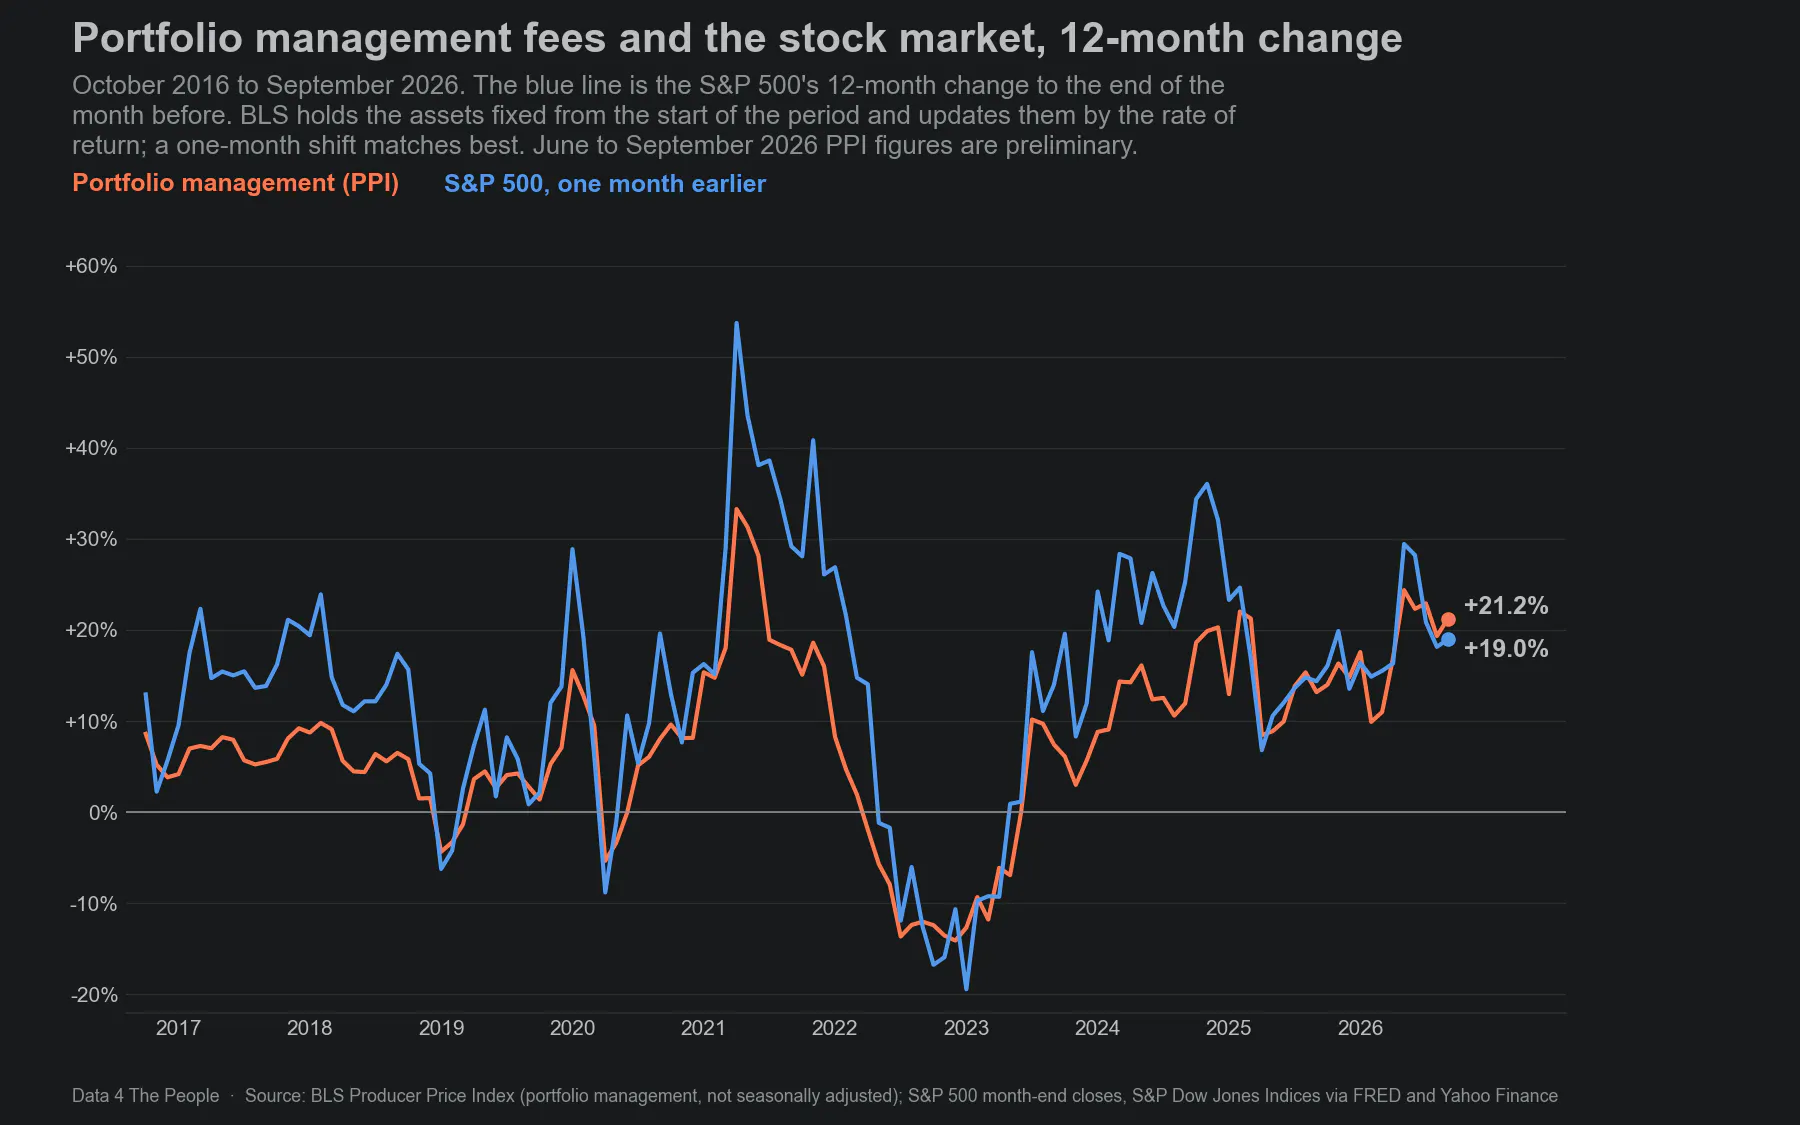
Portfolio management is the 12-month change in its PPI. The S&P 500 line is the 12-month change in its month-end close, to the end of the month before. Source: BLS; S&P Dow Jones Indices via FRED and Yahoo Finance.
The S&P 500 closed August 2026 19.0% higher than a year earlier. Portfolio management fees in September were up 21.2%. The two lines rose and fell together through 2022 and 2023, and both have risen since. The portfolio management index usually moves less than the S&P 500. Not every fee BLS tracks here is set as a share of assets, and managed portfolios hold more than U.S. stocks.
Long story short, if the market falls, the fees you pay your money manager tend to fall too. And when those fees fall, they put downward pressure on wholesale inflation. So this item can move wholesale inflation in either direction, depending on the market.
What are you finding in the data?
These are the five things that stood out to us. There are about 820 items in the diver, and every month back to October 2016. Explore it yourself.
The diver below is set to September 2026. Each anchor below the diver is an item whose price rose and pulled the total up. Each float above is an item whose price fell. The bigger the bubble, the more that item moved the total. Press Play to watch every month since October 2016, or pick a month and point at any bubble to see the item, its price change and how much it added.
Open the full visualization for a larger view and dark mode.
How we built this, and its limits
Data. Most numbers in this post come from the PPI Scuba Diver. The exceptions: the trucking chart uses the full BLS history of that index back to 2010; airline fares come from the BLS Consumer Price Index; the S&P 500 comes from S&P Dow Jones Indices, via FRED and Yahoo Finance; and the airline fuel cost shares come from BTS and IATA, as linked. The diver uses the BLS price index for each item in PPI final demand, not seasonally adjusted, and each item's weight from the relative importance tables BLS publishes each December. The visualization post explains the full method, and our code and data are on GitHub.
Preliminary data. BLS revises PPI for four months after first release. June to September 2026 are preliminary.
Adding up. Our items add up to 6.35 points for September 2026. BLS publishes a 12-month change of 6.34%. The gap comes from items with no published index, 1.6% of final demand by weight, which we estimate from the category they belong to, and from BLS rounding its indexes. In 2026 our items run slightly above BLS every month, and we have not found why. None of the items named in this post is estimated.
What this does not tell you. A contribution shows how much an item moved the published number. It does not explain why its price changed, and two lines moving together does not mean one caused the other. PPI is the price businesses receive, not what consumers pay.
Checking our work. We recomputed every 12-month change in this post from the raw BLS files, and a second check, run separately from scratch, matched every number in the charts.
Common questions
What was the PPI in September 2026?
PPI final demand rose 6.3% in the 12 months to September 2026, not seasonally adjusted. That is the largest 12-month increase since December 2022. The figure is preliminary, and BLS will revise it.
Why did the PPI rise so much in September 2026?
PPI final demand rose 6.3% in the 12 months to September 2026. Fuels added 1.93 points, about 30% of the rise. Regular gasoline, up 66.1%, added the most of any item, 0.76 points. Long-distance trucking, portfolio management and diesel fuel came next.
How much did trucking prices rise in September 2026?
Long-distance trucking prices in PPI final demand were 22.8% higher than a year earlier. That is the fifth-highest 12-month change since BLS began publishing it, behind only March to June 2022. The average before September 2026 was 3.6%.
How much did jet fuel prices rise?
Jet fuel prices in PPI final demand were 104.4% higher in September 2026 than a year earlier, the largest 12-month increase since June 2022.
Why are portfolio management fees in the PPI?
Portfolio management is a service sold to final buyers, so it is part of PPI final demand. BLS prices it mostly from fees charged as a share of assets managed, so it tends to move with financial markets.
Is the September 2026 PPI final?
No. BLS revises PPI data for four months after first release, so June to September 2026 are preliminary.
Support Data That Serves the Public
Data should empower people, not just institutions. Your support helps us create accessible research, visualizations, and tools that uncover economic inequality and inform better decisions.
Donate
Enjoying this post?
Tell others about it.
More articles like this
Fetching Related Posts
There are no other articles tagged with Data 4 Thought