
The PPI Scuba Diver: six takeaways from October 2026
Wholesale prices rose 6.5% in the 12 months to October 2026, the most since November 2022. Here is what moved the rate since September, and five more things we found in the data.

Eric Pachman
Published
November 16th 2026
The Bureau of Labor Statistics (BLS) released the October 2026 Producer Price Index on November 13, 2026. We ran it through the PPI Scuba Diver, our free animated chart of every item in the PPI for final demand, which now covers November 2016 to October 2026.
For last month's numbers, see our five takeaways from September 2026.
The Producer Price Index (PPI) measures the prices U.S. businesses receive for what they sell. It is often called wholesale inflation. In the 12 months to October 2026, PPI final demand rose 6.5%. That is the largest 12-month increase since November 2022.
Here are six findings that grabbed our attention. The diver itself is at the end of the post, so you can explore the data yourself.
Note: BLS revises PPI data for four months after it first publishes it. The figures for July to October 2026 are preliminary, so every October number in this post may change.
1. Wholesale prices rose 6.5%, the most since November 2022
PPI final demand is the BLS index that covers goods, services and construction sold to final buyers. The chart below shows the 12-month change in PPI final demand every month since November 2016. The bars split each month into goods, services and construction.
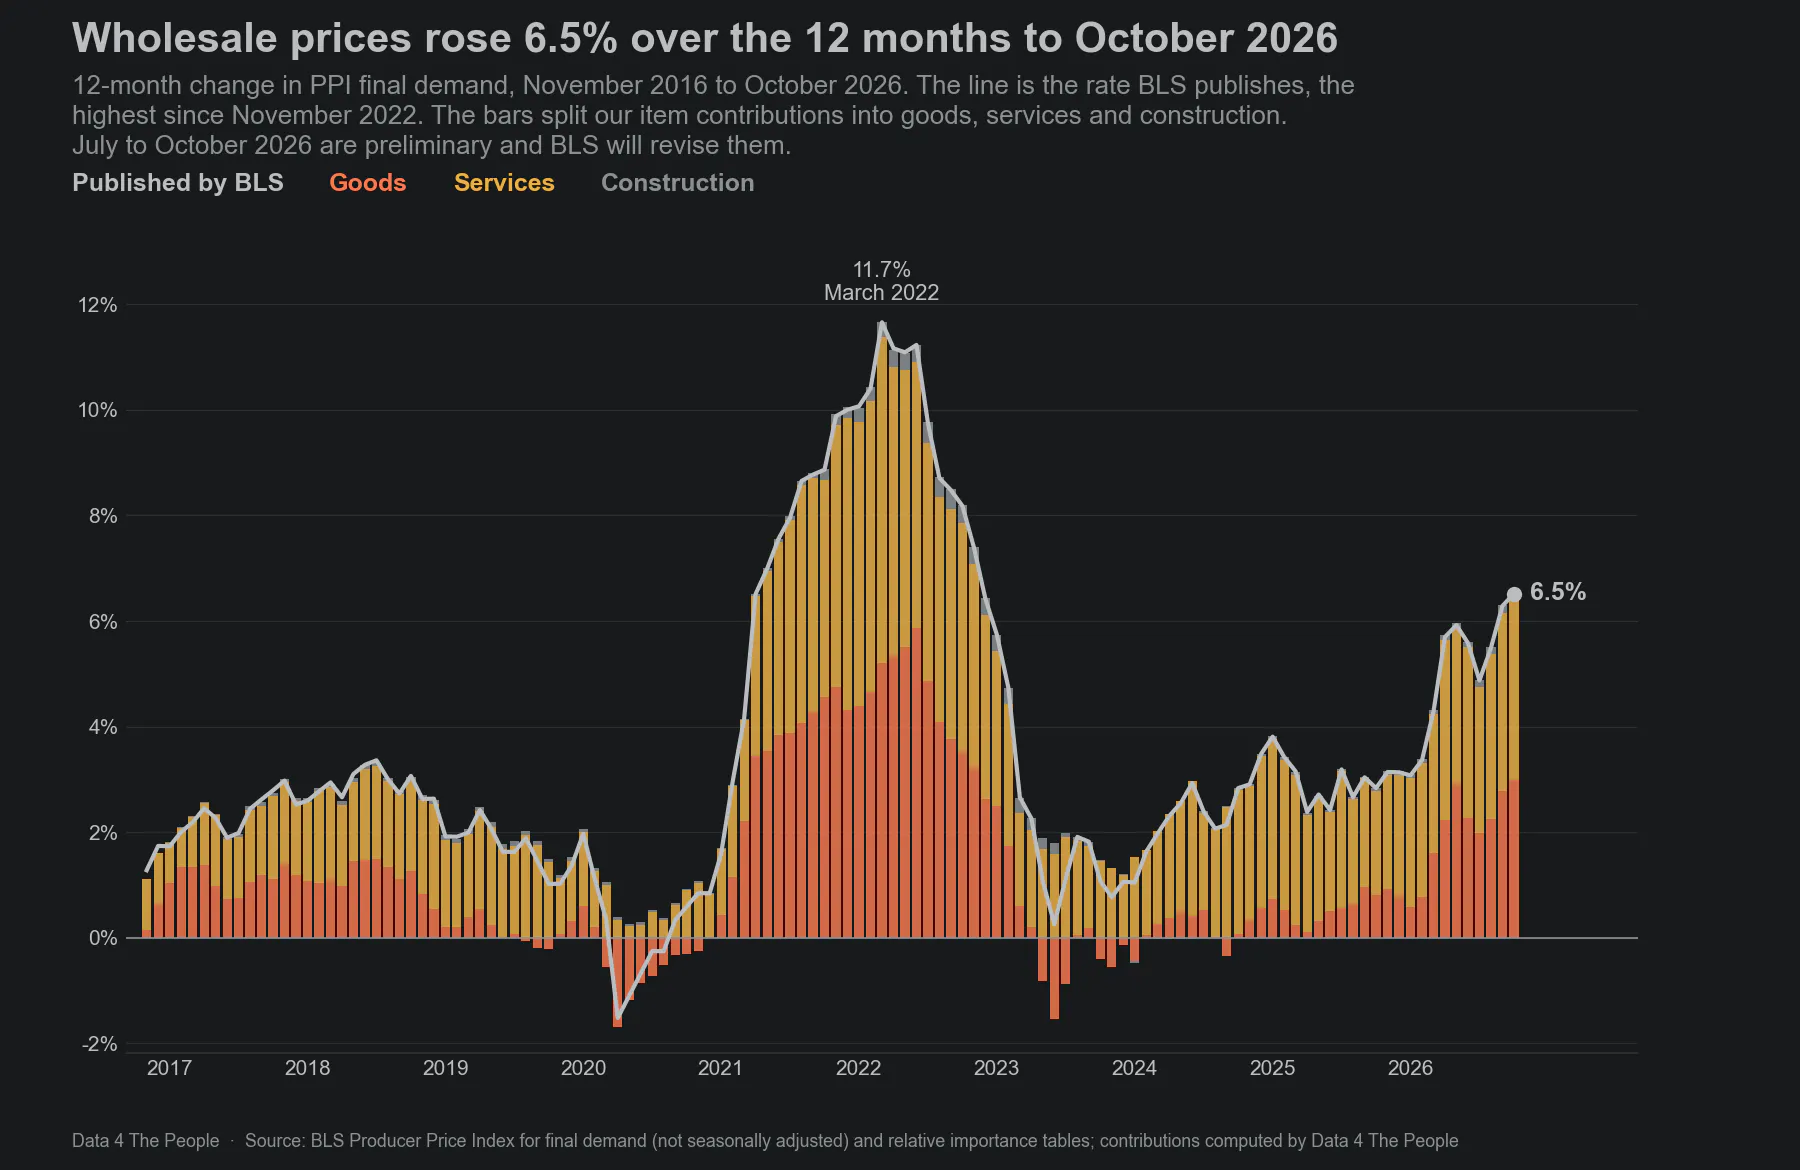
12-month change in PPI final demand, not seasonally adjusted. Bars are the sum of our item contributions for goods, services and construction. Source: BLS; contributions computed by Data 4 The People.
Services added 3.40 points of the rise, or 52%. Goods added 2.98 points, or 46%. Construction added 0.15 points, or 2%.
Of the 823 items in October, 676 added to the 12-month change, 109 took away from it and 38 had no effect.
2. What moved the rate from 6.3% to 6.5%
With BLS's revised indexes, September's 12-month change is 6.29%, down from 6.34% in the first release. October came in at 6.52%, so the 12-month rate rose 0.23 points in one month.
That small change hides a lot of movement underneath. Items that pushed the rate up added 1.19 points between them, and items that pulled it down took away 0.96 points. The chart below shows the 10 items that moved it most in each direction, and the rest of the items netted in one bar.
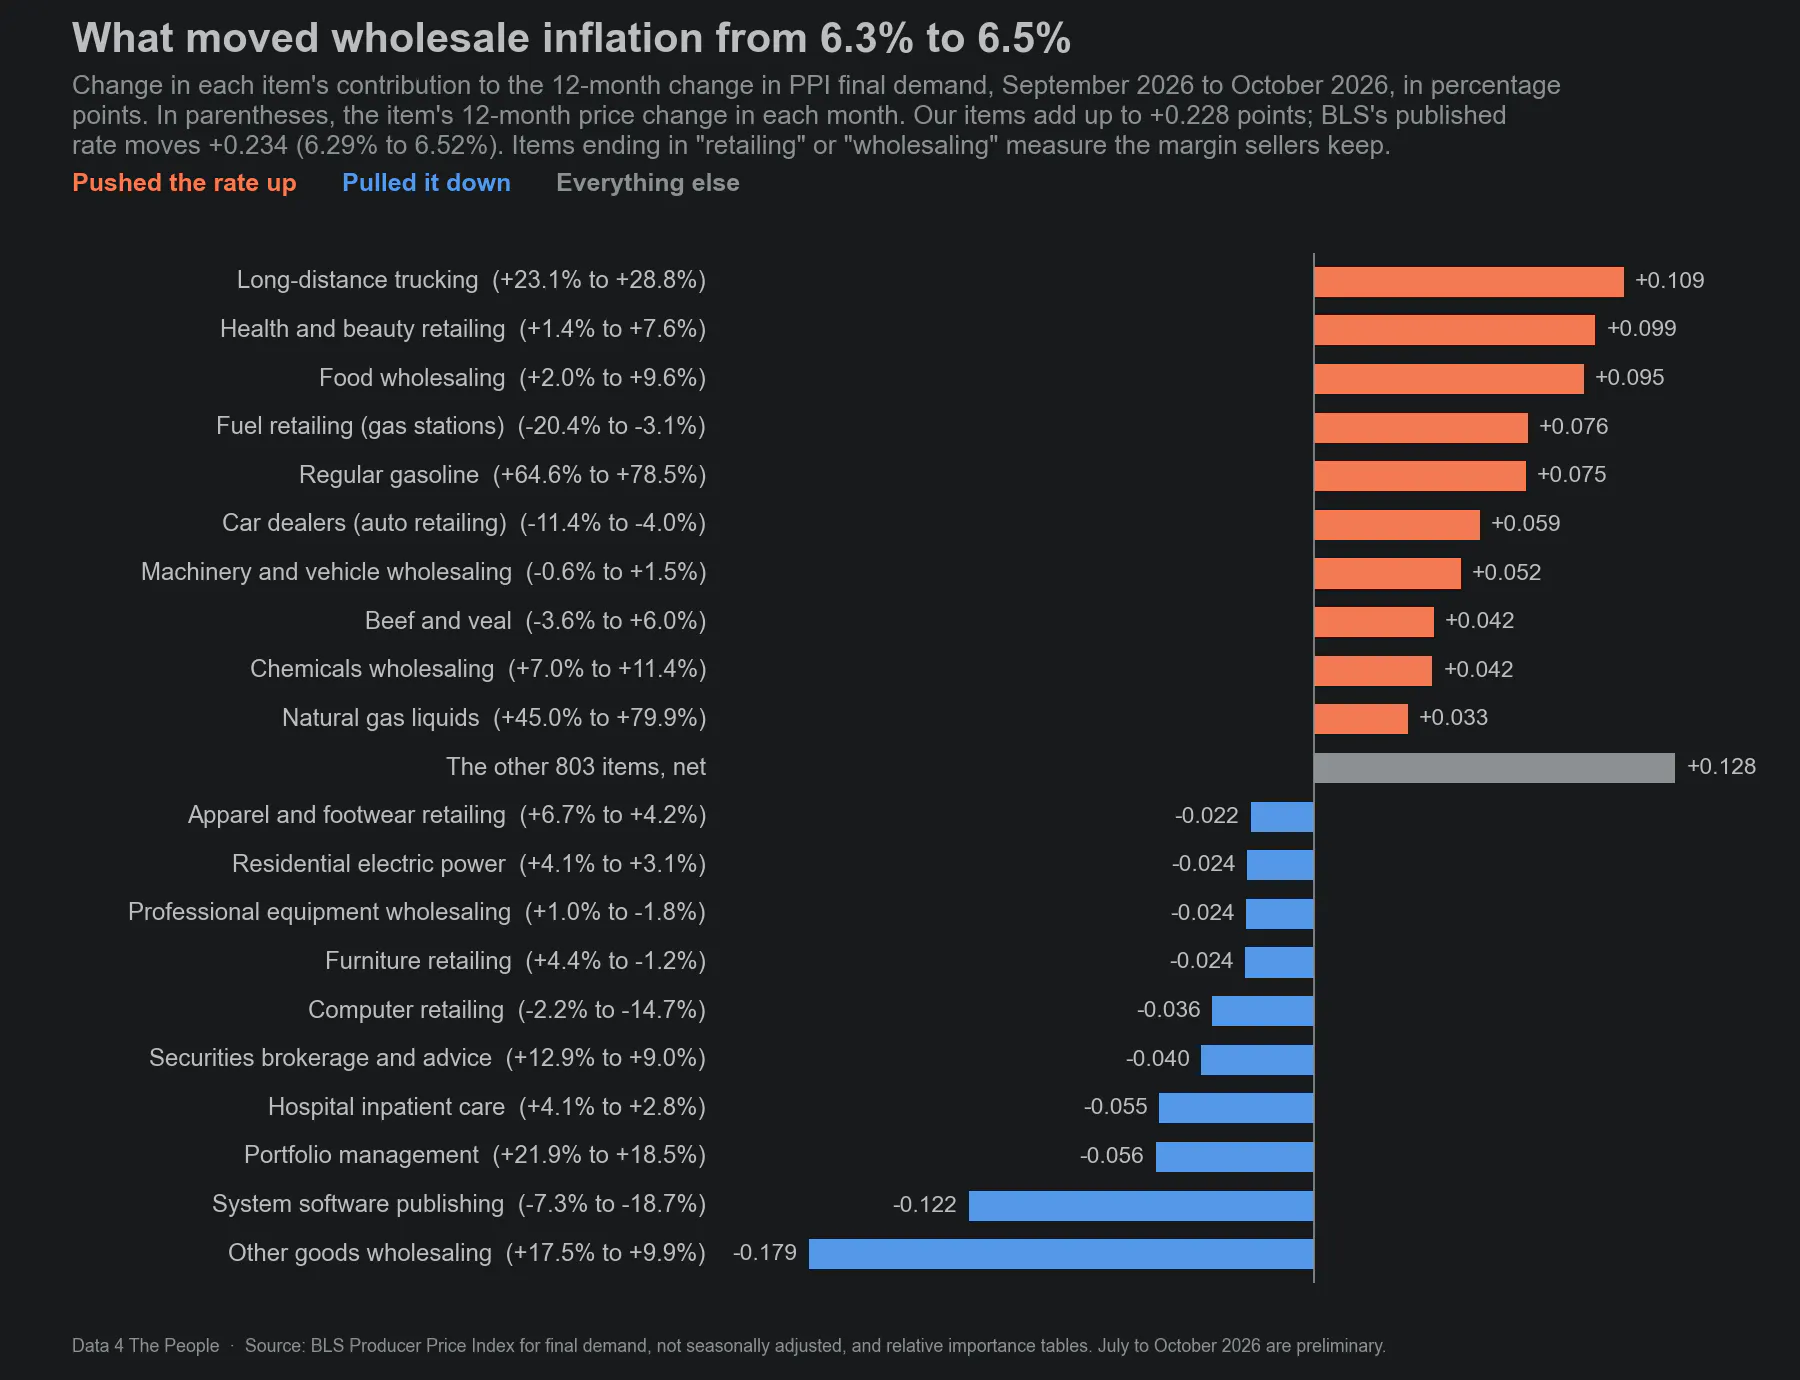
Each bar is the change in the item's contribution to the 12-month change in PPI final demand from September to October 2026, in percentage points. September is as revised. Source: BLS; contributions computed by Data 4 The People.
Long-distance trucking added the most, 0.11 points, as its 12-month price change rose from 23.1% to 28.8%.
Note that several of the largest moves, both up and down, were trade margins. For these items, BLS prices the margin: what the seller charges minus what it paid for the same good. That gap is measured in dollars, so it can grow when costs rise even if the seller's markup stays the same. In other words, a rising margin does not by itself mean higher profit.
That said, several of these margins moved a lot this month. Health and beauty retailing margins went from 1.4% to 7.6% higher than a year earlier, and food wholesaling margins went from 2.0% to 9.6%. In the other direction, margins for other goods wholesaling went from 17.5% to 9.9%, which took 0.18 points off the rate, the largest pull of any item.
Fuel retailing, the margin at gas stations, was still lower than a year earlier, but by much less. It went from 20.4% lower in September to 3.1% lower in October, which added 0.08 points. Note what this is telling us. Even with wholesale gasoline prices 78.5% higher than a year earlier, gas stations kept a smaller margin per gallon in both September and October 2026 than they did a year before.
3. Long-distance trucking hit its highest rate on record
Long-distance trucking prices were 28.8% higher in October 2026 than a year earlier. It added 0.57 points to the 12-month change, the second-largest addition of any item, after regular gasoline.
The chart below goes back further than the diver, to June 2010, the first 12-month change available since BLS began publishing this index in June 2009. The dashed line is the average of every month before October 2026.
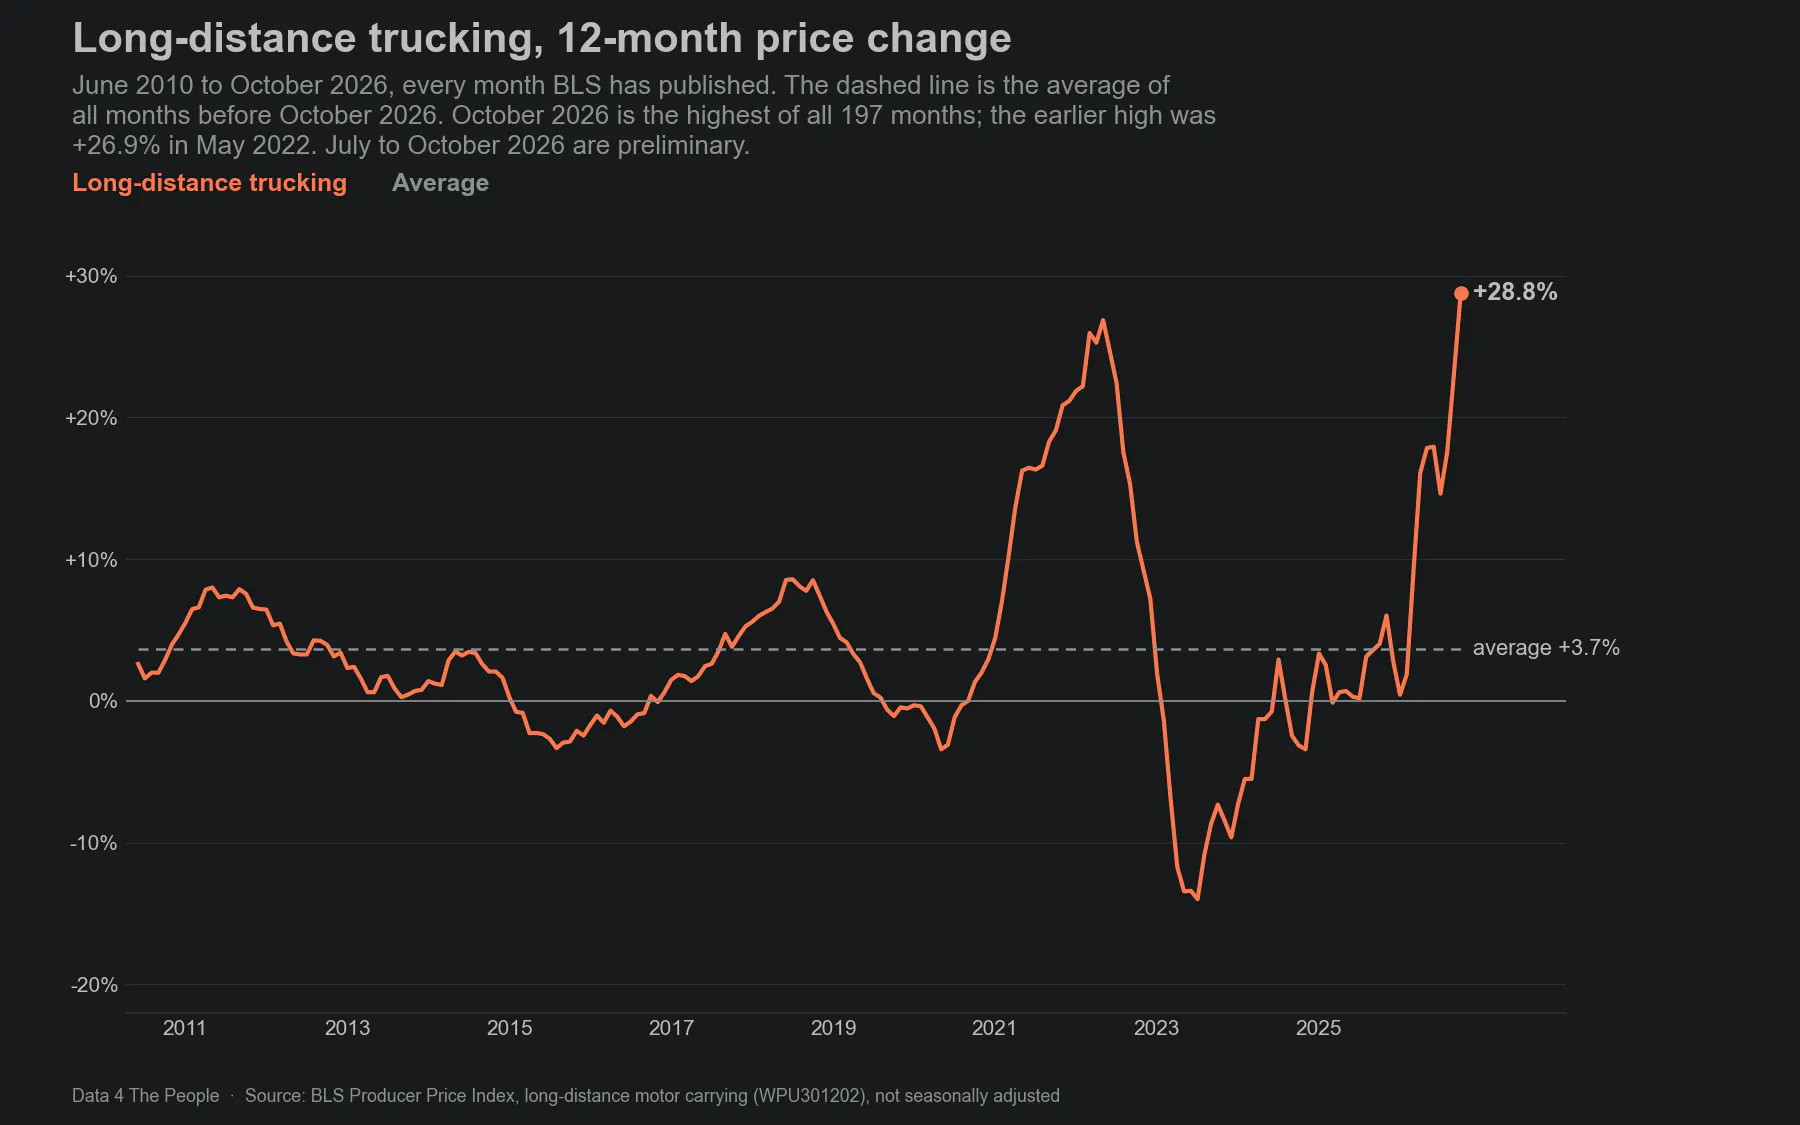
12-month price change in long-distance motor carrying, every month BLS has published. The dashed line is the average of all months before October 2026. July to October 2026 are preliminary. Source: BLS.
October 2026 is the highest of all 197 months. The earlier high was 26.9% in May 2022. The average before this month was 3.7%.
Over the same 12 months, the price of diesel fuel rose 115.2%. Much of the freight that moves under contract carries a fuel surcharge that is reset each week from the diesel price, and BLS has noted that its transportation price indexes follow those surcharges up and down. Our Diesel Fuel Surcharge Calculator shows how a diesel price becomes a surcharge on a truckload, LTL or rail bill.
4. System software prices fell 18.7%
System software publishing, which is software that runs computers and networks rather than doing a task for the user, such as operating systems, network software and database software, is 0.9% of final demand in BLS's December 2025 weights, fell 18.7% over the 12 months to October 2026. It took 0.18 points off the 12-month change, more than any other item.
BLS began this index in May 2022, so the chart below starts with its first 12-month change in May 2023.
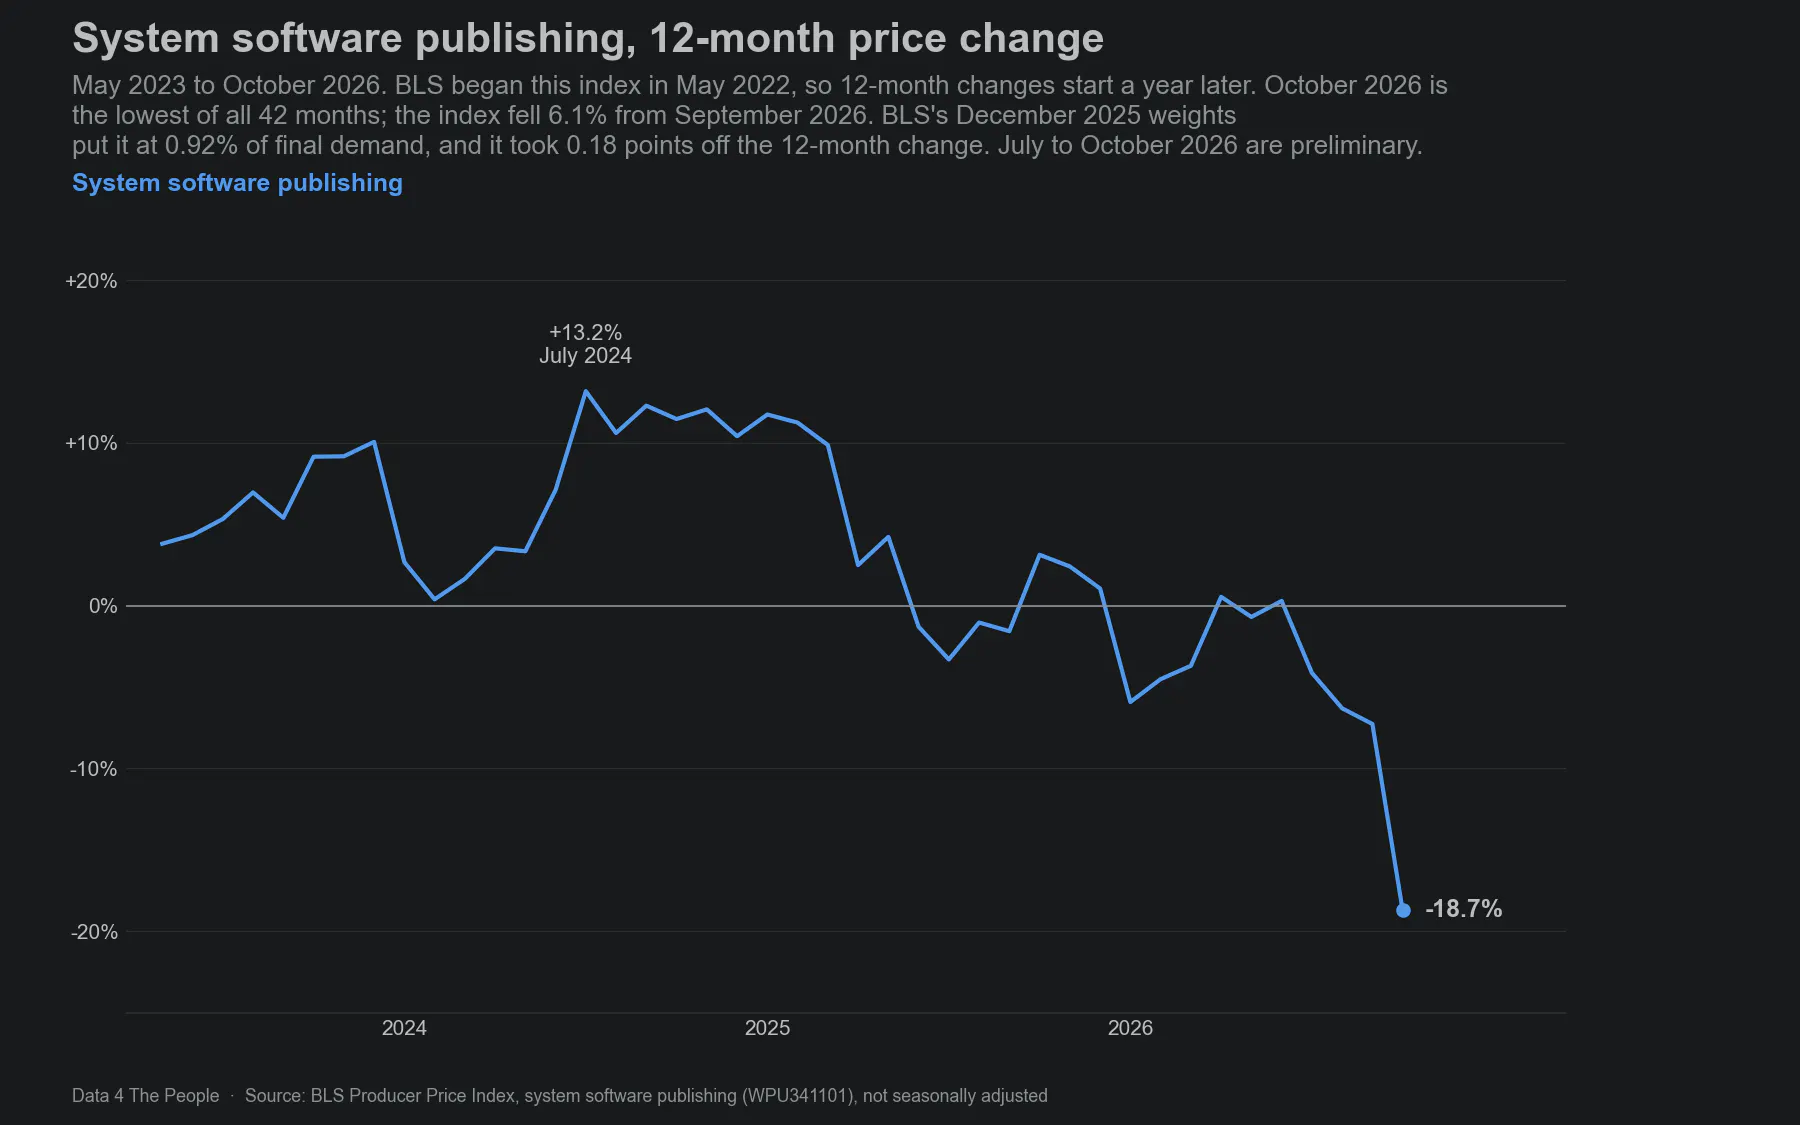
12-month price change in system software publishing, not seasonally adjusted. July to October 2026 are preliminary. Source: BLS.
October is the lowest of the 42 months. Most of the drop came in one month: the index fell 6.1% from September to October. In September it was 7.3% lower than a year earlier, and a year ago, in October 2025, it was 3.1% higher.
5. Fuels added 1.9 points
The fuels and power group, which includes gasoline, diesel, jet fuel, heating oil, electricity and natural gas, added 1.92 points to the 12-month change. That is 29.5% of the 6.53 points our items add up to, from a group that is 5.1% of final demand in BLS's December 2025 weights. The chart below compares the fuels group with every other item since November 2016.
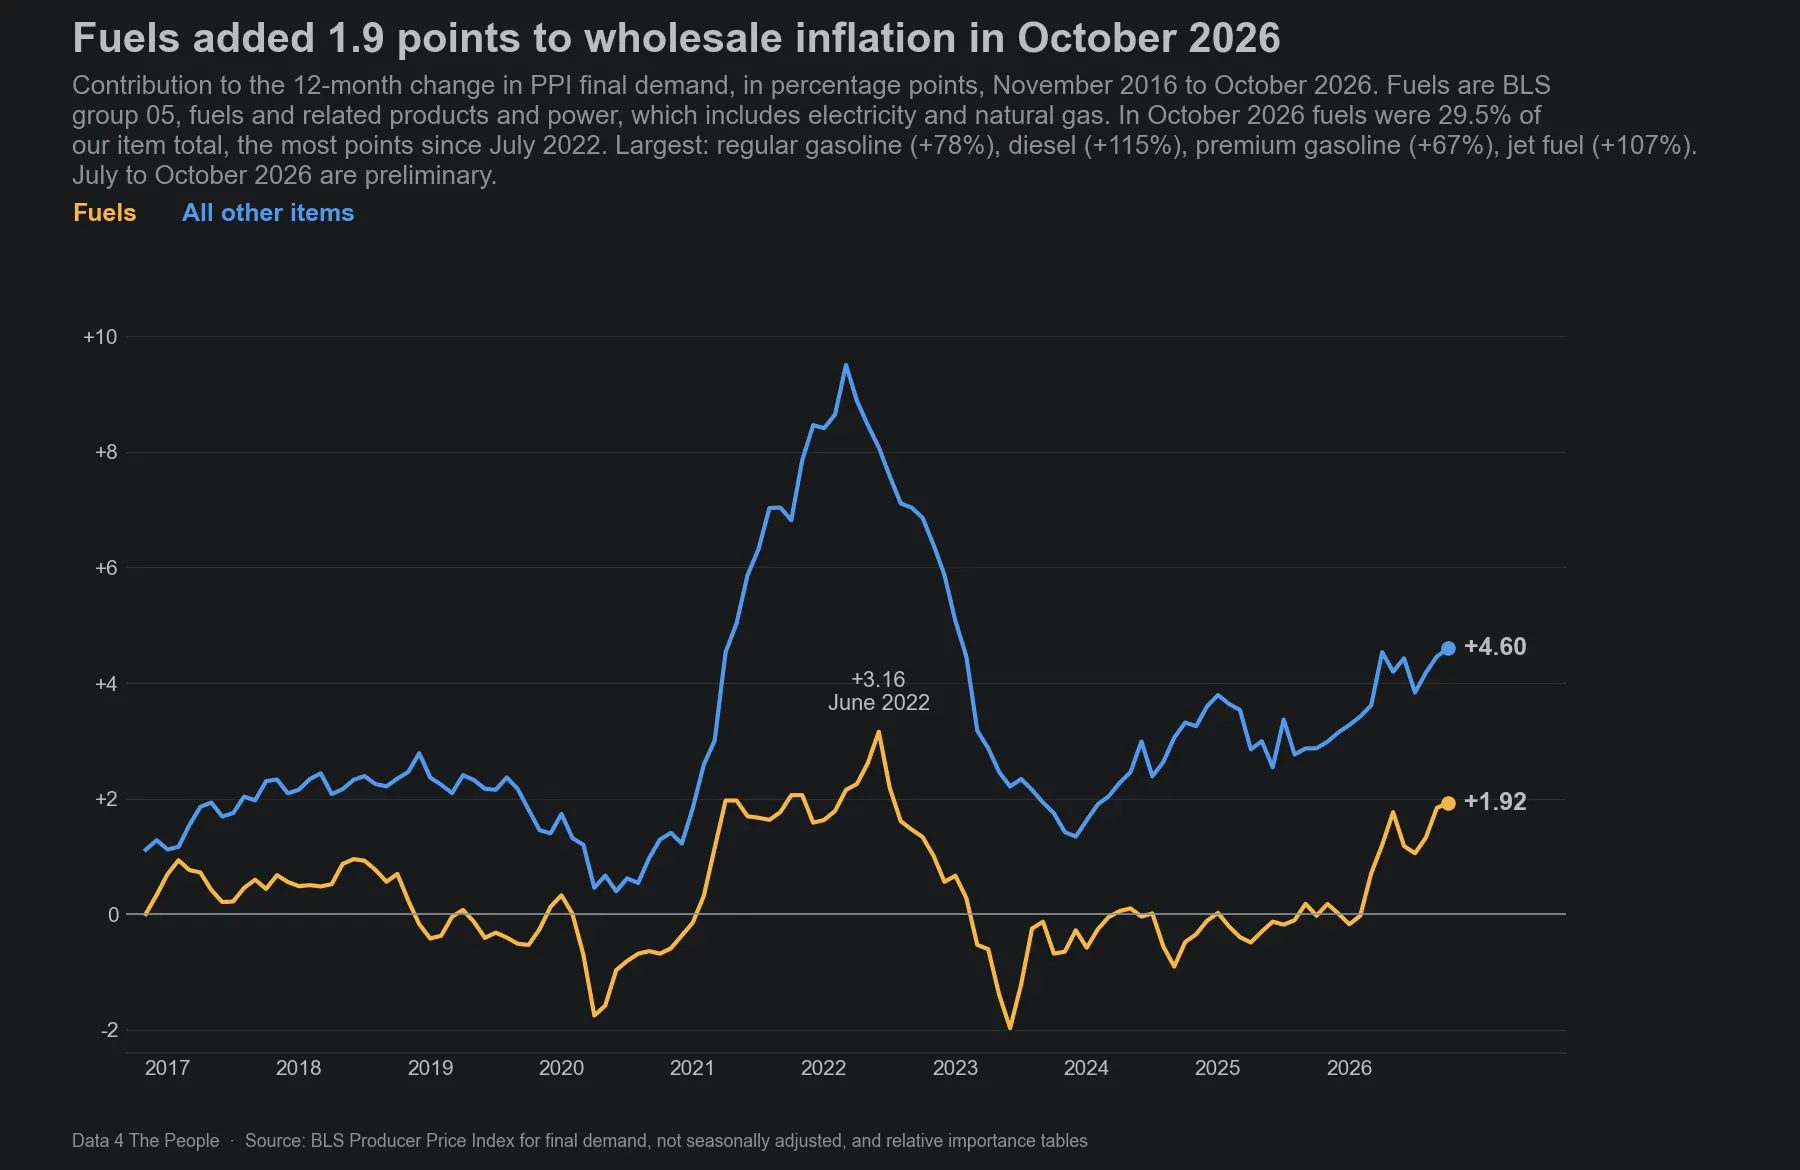
Contribution to the 12-month change in PPI final demand, in percentage points. Fuels are BLS commodity group 05, fuels and related products and power. Source: BLS; contributions computed by Data 4 The People.
It is the most fuels have added since July 2022.
Regular gasoline added the most of any item, 0.82 points, with a price 78.5% higher than a year earlier. It is 1.0% of final demand in BLS's December 2025 weights, but it added 12.6% of the rise. Diesel fuel rose 115.2%, the largest 12-month increase since June 2021, and added 0.37 points. Jet fuel rose 106.5%, the largest since June 2022.
6. Prices for some data center hardware jumped
We looked at nine items used to build and run data centers: computer hardware, the power equipment that feeds it, and hosting services. BLS has no data center category for these items. Each item is also sold to other buyers, so we can't isolate the data-center-only effect on prices. Still, the chart below, which compares each item's 12-month price change in October 2025 and October 2026, is telling:
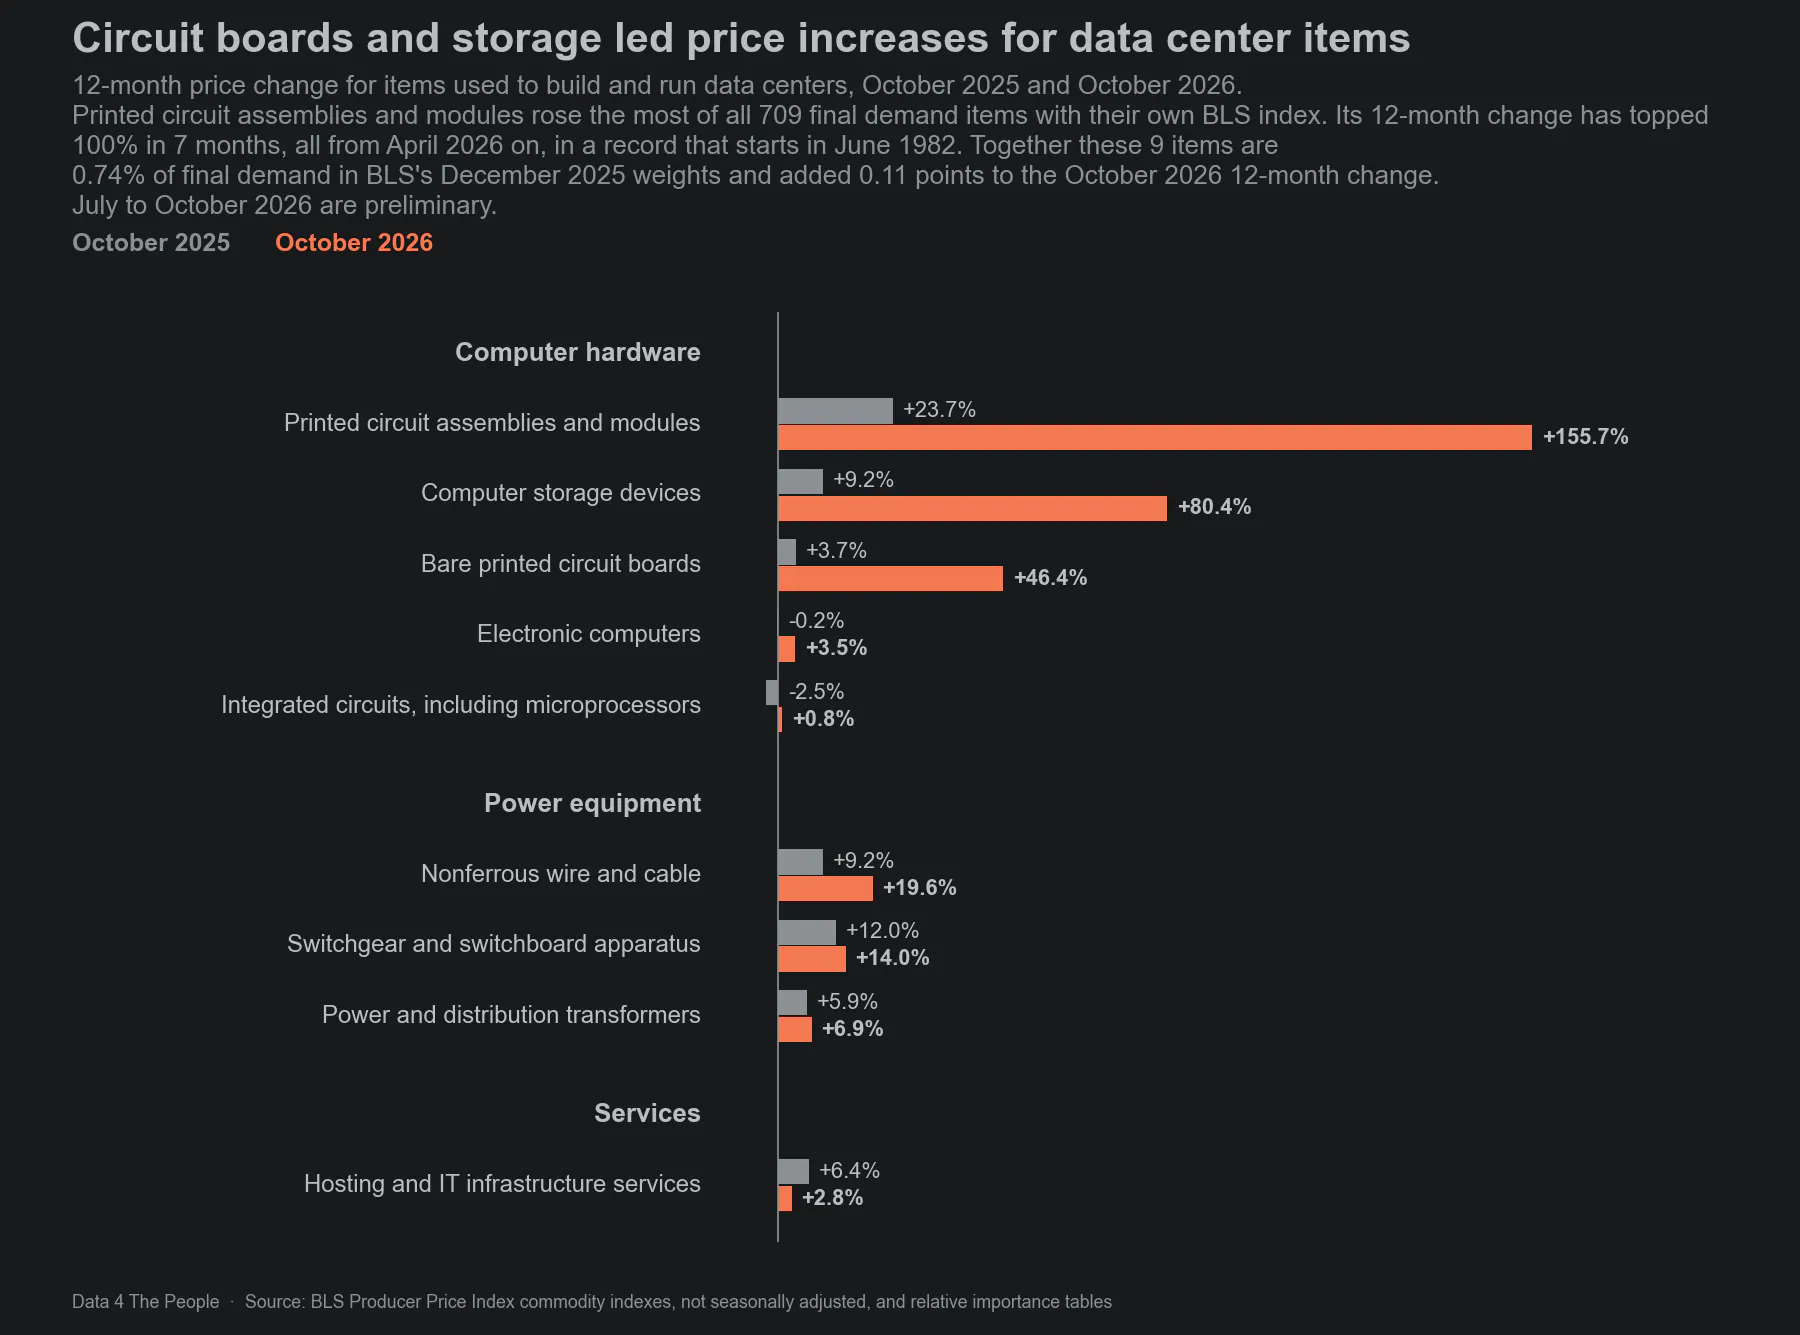
12-month price change, not seasonally adjusted. July to October 2026 are preliminary. Source: BLS.
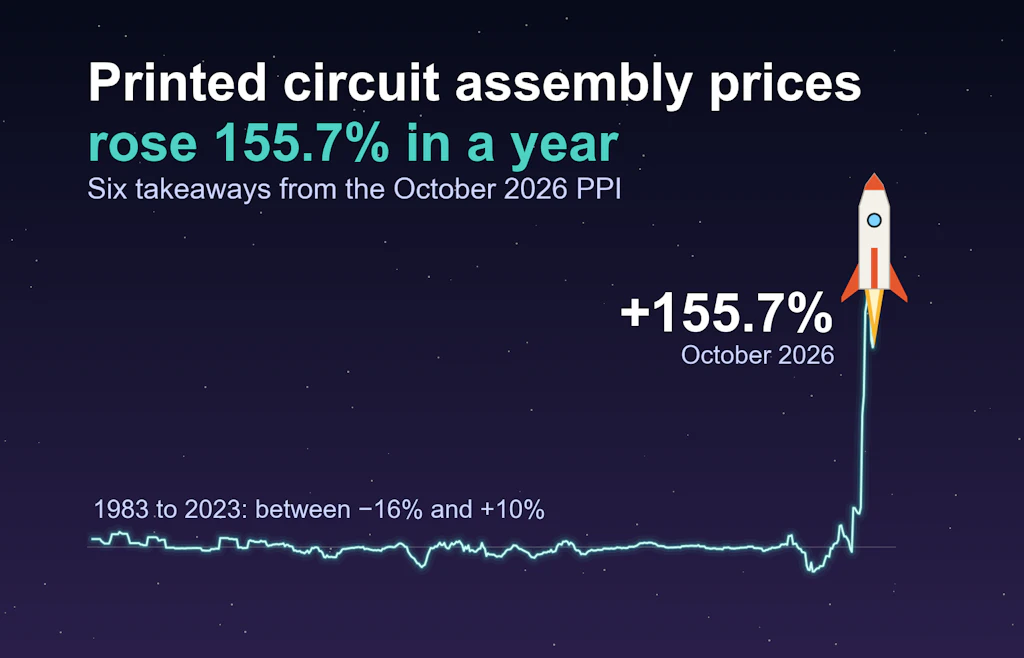
Printed circuit assemblies and modules rose 155.7%, the largest 12-month increase of the 709 final demand items with their own index. A year earlier it was up 23.7%. Its 12-month change has been above 100% every month since April 2026 and peaked at 172.0% in June. Its index goes back to June 1982, and it never topped 100% before this year.
Before 2024, its 12-month change never went above 9.9%. Before 2026, the highest was 25.6% in August 2025. The chart below shows every 12-month change since June 1983, the first month BLS can compare with a year earlier.
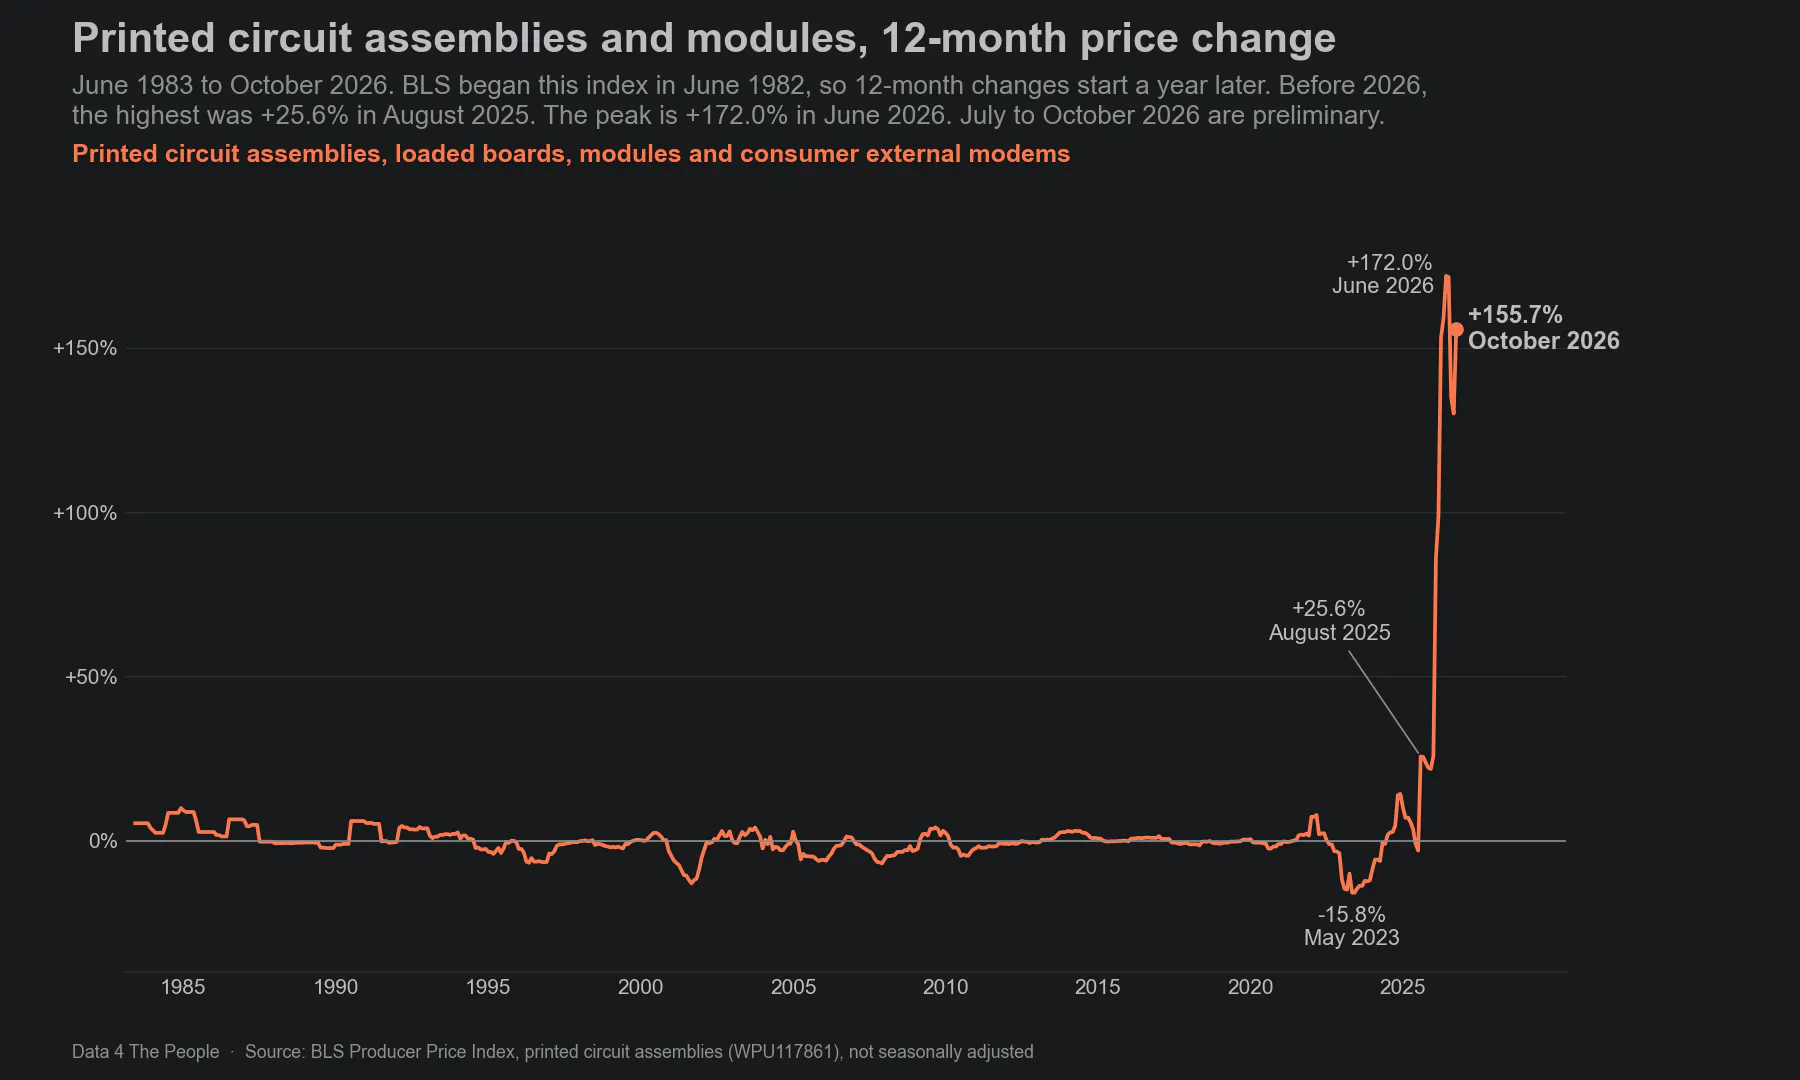
12-month price change in printed circuit assemblies, loaded boards, modules and consumer external modems, not seasonally adjusted. July to October 2026 are preliminary. Source: BLS.
Computer storage devices rose 80.4%. Bare printed circuit boards rose 46.4%, the largest 12-month increase since its index began in 2000.
The three power equipment items rose less, but each rose faster than a year earlier: nonferrous wire and cable 19.6%, switchgear 14.0% and power and distribution transformers 6.9%. Some items barely moved. Electronic computers rose 3.5%, and integrated circuits, including microprocessors, rose 0.8%. Hosting and IT infrastructure services rose 2.8%, down from 6.4% a year earlier.
These nine items add up to only 0.74% of final demand in BLS's December 2025 weights. But their prices rose so much that together they added 0.11 points to the 12-month change.
What are you finding in the data?
These are the six things that stood out to us. There are about 820 items in the diver, and every month back to November 2016. Explore it yourself in the free PPI Scuba Diver.
The diver below is set to October 2026. Each anchor below the diver is an item whose price rose and pulled the total up. Each float above is an item whose price fell. The bigger the bubble, the more that item moved the total. Press Play to watch every month since November 2016, or pick a month and point at any bubble to see the item, its price change and how much it added.
Open the full visualization for a larger view and dark mode.
How we built this, and its limits
For the full method, see the PPI Scuba Diver post and our method notes on GitHub.
Data. Most numbers in this post come from the PPI Scuba Diver. The exceptions: the trucking chart uses the full BLS history of that index back to 2010, the software chart uses that index's full history back to 2022, the data center chart uses each item's own BLS index and BLS's December 2025 weights, and the printed circuit assemblies chart uses that index's full history back to 1983. The diver uses the BLS price index for each item in PPI final demand, not seasonally adjusted, and each item's weight from the relative importance tables BLS publishes each December. Our code and data are on GitHub.
Preliminary data. BLS revises PPI for four months after first release. July to October 2026 are preliminary. This release also revised June to September.
Month to month. The change in an item's contribution from September to October mixes two things: the item's price move in October 2026, and its October 2025 price replacing September 2025 as the starting point. A large bar can come from either one.
Adding up. Our items add up to 6.53 points for October 2026. BLS publishes a 12-month change of 6.52%. The gap comes from items with no published index, 1.5% of final demand by weight, which we estimate from the category they belong to, and from BLS rounding its indexes. In 2026 our items run slightly above BLS every month, and we have not found why. None of the items named in this post is estimated.
What this does not tell you. A contribution shows how much an item moved the published number. It does not explain why its price changed, and two lines moving together does not mean one caused the other. PPI is the price businesses receive, not what consumers pay.
Checking our work. We recomputed every 12-month change in this post from the raw BLS files, and a second check, run separately from scratch, matched every number in the charts.
Common questions
What was the PPI in October 2026?
PPI final demand rose 6.5% in the 12 months to October 2026, not seasonally adjusted. That is the largest 12-month increase since November 2022. The figure is preliminary, and BLS will revise it.
Why did the PPI rise from September to October 2026?
The 12-month rate rose from 6.29% in September, as revised, to 6.52% in October. Long-distance trucking, health and beauty retailing margins, food wholesaling margins, gas station margins and regular gasoline pushed it up the most. Other goods wholesaling margins and system software publishing pulled it down the most.
How much did trucking prices rise in October 2026?
Long-distance trucking prices in PPI final demand were 28.8% higher than a year earlier, the highest 12-month change since BLS began publishing the index. The earlier high was 26.9% in May 2022.
How much did fuels add to the PPI in October 2026?
The fuels and power group added 1.92 points to the 12-month change, 29.5% of the total, the most since July 2022. Regular gasoline, up 78.5%, added the most of any item, 0.82 points.
How much did data center hardware prices rise in October 2026?
Printed circuit assemblies and modules were 155.7% more expensive than a year earlier, the largest increase of any final demand item with its own index. Computer storage devices rose 80.4% and bare printed circuit boards 46.4%. Hosting and IT infrastructure services rose 2.8%.
What is the PPI?
The Producer Price Index (PPI) is a set of price indexes from the Bureau of Labor Statistics that measure the prices U.S. businesses receive for what they sell. The headline number, PPI final demand, covers goods, services and construction. It is often called wholesale inflation. Our free PPI Scuba Diver shows every item in it.
Is the October 2026 PPI final?
No. BLS revises PPI data for four months after first release, so July to October 2026 are preliminary.
Support Data That Serves the Public
Data should empower people, not just institutions. Your support helps us create accessible research, visualizations, and tools that uncover economic inequality and inform better decisions.
Donate
Enjoying this post?
Tell others about it.
More articles like this
Fetching Related Posts
There are no other articles tagged with Data 4 Thought