
Oil Update: The Biggest Commercial Crude Draw of the War
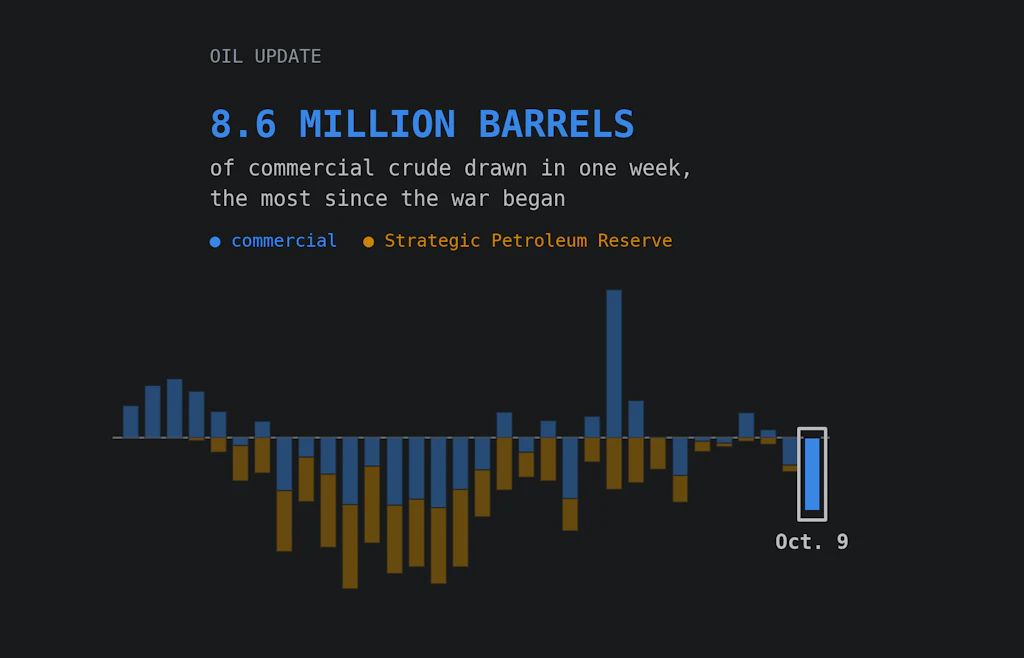
U.S. crude stocks fell 8.6 million barrels last week, all of it from commercial tanks. Diesel stocks are the lowest for this time of year since 1982.

Eric Pachman
Published
October 16th 2026
Yesterday, the Energy Information Administration (EIA) released its weekly oil inventory report, a day later than usual because of the Columbus Day holiday. It covers the week ending October 9.
The report showed the largest commercial crude oil draw since before the war started. We figured we should flag this for you, not because anything can be done about it at this stage, but because it's a good chance to understand how we let this happen. To assist you with that, we've included links to a selection of our writing on oil markets over the past few months. We do this not to take a victory lap. There are no winners with what is going on here. It's to illustrate how valuable it is to have a basic level of education on things like how a refinery works. I constantly wonder: if we had all known how a refinery worked back in March, would we have done something differently to avoid this fate? I'll never know the answer, but if D4TP's vision plays out, there will be a day when we all see through the raging tempest of noise to a shared truth.
That said, here's the update on yesterday's data.
Crude oil: a big draw, and none of it from the reserve
U.S. crude oil stocks fell 8.6 million barrels last week. That figure combines two parts: commercial stocks, held by companies, and the Strategic Petroleum Reserve (SPR), held by the government. All of last week's drop came from commercial stocks. It was the largest weekly drop in commercial crude since the war began on February 28.
It was not the largest drop in total crude, though. The chart below shows the weekly change in both parts since the war began.
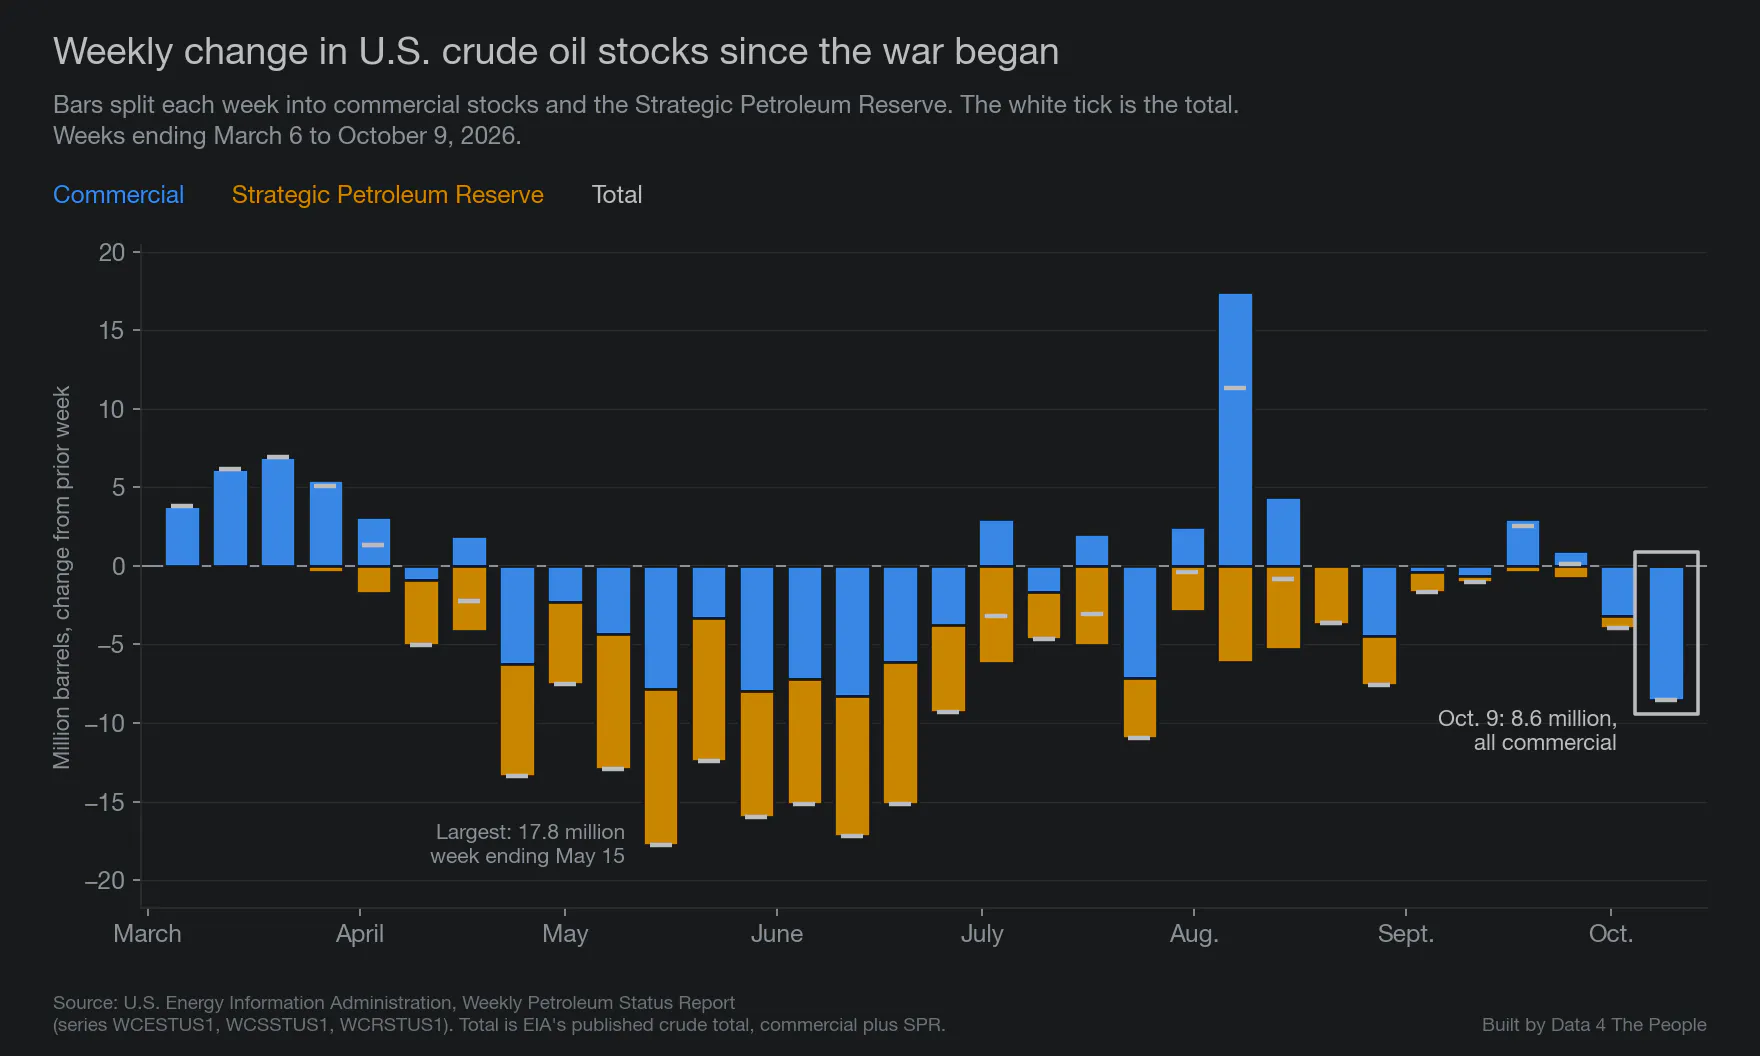
Weekly change in U.S. crude oil stocks, commercial and Strategic Petroleum Reserve, weeks ending March 6 to October 9, 2026. Source: EIA Weekly Petroleum Status Report.
The biggest weeks came in May and June, when the SPR was releasing the most oil. The largest was the week ending May 15, when total stocks fell 17.8 million barrels, and 56% of that came from the reserve. Last week ranks 11th of the 32 weeks since the war began. It was the largest total drop since the week ending July 24.
What stands out is that the SPR did not change at all. Last week was the first week since March 20 without a draw from the reserve. Since the war began, total crude stocks have fallen 156.2 million barrels, and 132.5 million of that, or 85%, came from the SPR. As we covered in Meet the Speculative Petroleum Reserve, the government has been lending that oil to companies in rounds. In our view, the reserve will likely start to draw again once the current round of loans is awarded.
Diesel: the lowest for this time of year since 1982
Diesel stocks fell 2.5 million barrels last week, a drop of 2.4%, to 102.6 million barrels. (EIA counts diesel and heating oil together as distillate fuel oil.) That is the lowest level for this week of the year in EIA's weekly data, which goes back to 1982. The next lowest was 106.1 million barrels in 2022. Stocks are 12.2% below the average for the same week from 2021 to 2025.
The animation below draws every year of diesel stocks since 1982, then slows down to add 2026 one week at a time.

Diesel and heating oil stocks by week of the year, 1982 to 2026. The red line is 2026, through the week ending October 9. Source: EIA weekly stocks, series WDISTUS1.
In August, we wrote that we may be running out of the fuel that runs our economy. Diesel stocks are lower now than they were then, and we are now heading into the winter, which increases the demand for heating oil, a close cousin to diesel.
Gasoline: back in the normal range
Gasoline looks better. Stocks rose 3.5 million barrels last week, a gain of 1.7%, to 208.3 million barrels. That was the largest weekly gain since the war began. Gasoline stocks are 4.4% below the average for the same week from 2021 to 2025, but they sit near the middle of the range since 1990: 15 of the 36 earlier years were lower at this point.
The same animation for gasoline shows 2026 starting the year well above the usual range and falling back into the normal range by late April.

Gasoline stocks by week of the year, 1990 to 2026. The red line is 2026, through the week ending October 9. Source: EIA weekly stocks, series WGTSTUS1.
Our coverage of the 2026 energy crisis
Since June, we have followed the war's effects on oil, fuel and the things made from them. Here is a selection of those pieces in one place, oldest first.
- Even if oil falls, your gas might not. Here's why. (June 3, 2026): why pump prices can stay high when crude falls, by looking at the refining margin.
- Accountability is Patriotism: Uncle Sam's Magic Oil Disappearing Act (July 3, 2026): U.S. crude stocks falling toward 40-year lows while crude exports continue.
- RIP: U.S. Energy Strategy (July 23, 2026): why fuel prices depend on a refining mismatch that the war disrupted.
- We May Be Running Out of the Fuel That Runs Our Economy (August 23, 2026): diesel supplies near 30-year lows.
- Turns out oil is close to $150, in real life, not on your screen (September 14, 2026): what a barrel of Middle East crude costs once it is delivered, with tankers avoiding the Strait of Hormuz.
- Diesel Fuel Surcharge Calculator (September 23, 2026): a free tool that shows how diesel prices reach freight bills and consumer prices.
- Why you should care about sulfur (October 8, 2026): how the war tightened the supply of sulfur, a refinery byproduct used to make fertilizer.
- Meet the Speculative Petroleum Reserve (October 11, 2026): how the government is lending emergency oil, and who borrowed it.
- Sell It or Lend It? With Our Emergency Oil, the Devil Is in the Details (October 13, 2026): how the 2022 SPR sales compare with the 2026 loans.
You can follow U.S. oil and fuel stocks each week in our free petroleum inventory tool.
About the data
All figures come from EIA's Weekly Petroleum Status Report: commercial crude oil (series WCESTUS1), crude oil in the SPR (WCSSTUS1), total crude oil including the SPR (WCRSTUS1), distillate fuel oil (WDISTUS1) and total gasoline (WGTSTUS1). Weekly commercial figures are estimates from a survey of companies, so any one week's change can be off, and EIA's monthly data later replaces them. The SPR figure is a count from the Department of Energy. "Since the war began" means the 32 weeks ending March 6 through October 9, 2026. For diesel and gasoline, "this week of the year" compares the week ending October 9 with the week closest to the same date in every earlier year, since 1982 for diesel and 1990 for gasoline.
Common questions
How much crude oil did U.S. stocks fall in the week ending October 9, 2026?
Total crude oil stocks fell 8.6 million barrels, all from commercial stocks. It was the largest weekly drop in commercial crude since the war began on February 28, 2026.
Why didn't the Strategic Petroleum Reserve change that week?
The government has been lending reserve oil to companies in rounds. In our view, the reserve will likely start to draw again once the current round of loans is awarded.
Are U.S. diesel stocks low right now?
Yes. At 102.6 million barrels, diesel stocks were the lowest for this week of the year in EIA's weekly data going back to 1982, and 12.2% below the 2021 to 2025 average.
How much crude oil has the U.S. drawn since the war began?
Total crude stocks fell 156.2 million barrels from February 28 to October 9, 2026. About 85% of that came from the Strategic Petroleum Reserve.
Support Data That Serves the Public
Data should empower people, not just institutions. Your support helps us create accessible research, visualizations, and tools that uncover economic inequality and inform better decisions.
Donate
Enjoying this post?
Tell others about it.
More articles like this
Fetching Related Posts
There are no other articles tagged with Data 4 Thought