

The Missing Numbers on America's National Parks
For 16 years, the Park Service published every park's budget and staff. After FY2023, that table stops.

Eric Pachman
Published
October 23rd 2026
Our analysis of rivers a few days ago got us thinking more about nature, and specifically how we measure it. And when it comes to the awesomeness of nature, few places compare with America’s national parks. As an American, I surely am biased. But walk the Fortynine Palms Oasis Trail in Joshua Tree, where miles of dry, rocky high desert suddenly give way to a hidden grove of palm trees and green shade, or drive across the flat valley floor into Great Sand Dunes National Park, where the tallest sand dunes in North America rise against the Rocky Mountains, and tell me I am wrong. Several of my core memories – ones that are associated with complete peace and awe – are in America’s national parks. If you are lucky, some of yours are too. And so, it felt fitting to spend some time this Friday giving some data love to these magical locations.
Not long into my research, my blissful memories of my national park experiences gave way to the stark reality of the plight of our parks. Visits are rising, just about everywhere, while park budgets have fallen behind inflation, just about everywhere. But it gets worse – park-level funding and staffing levels stopped getting published after FY2023. The numbers for later years are simply gone, leaving Americans in the dark on the data we need to know if our government is making proper investments in these national treasures.
And so, today we share with you the data that still exists for all 63 national parks, in our latest interactive data visualization.
Pick a measure to color the map below, or click a park to see its visits, base budget and staff by year, from 2008 on. The map is free to use, and the data and code behind it are on GitHub.
How to use the tool
- Color the map. The menu at the top switches the colors between the change in visits, base budget, staff and budget per visit.
- Pick a park. Click a dot or choose a park from the list. The panel shows a short history of the park and its charts.
- Zoom in. Use the + and − buttons, or pinch on a phone, to separate parks that sit close together.
- See the full record. The visit chart starts in 2008. A switch above it shows every year back to 1979.
- Read the notes. Dashed lines mark years when a park changed how it counts visits. The box on the first screen lists what is missing.
The numbers stop
For 16 straight years, the National Park Service's yearly budget book for Congress included a table with each park's budget and staff. The book is called a budget justification, or the Green Book, and each one reports each park's actual figures from two years earlier. The books for fiscal years 2010 through 2025 carry the table, so the record runs from FY2008 to FY2023. That is the last year we can find for every park. Visit counts are different. They come from a separate Park Service system that still posts every park's numbers each month, so they run through 2025.
Mount Rainier shows what that record looks like at one park. Visits rose from 1.0 million in 2012 to 1.6 million in 2025, an increase of 56%. However, over FY2012 to FY2023, its base budget fell 15% after inflation, from $17.0 million to $14.4 million in FY2025 dollars. The chart below shows both, up to the point where the table ends. The chart also shows you that those last two years of extra visitor data don't explain the visitor / funding divergence - from 2012 to 2023 Mount Rainier visits were up 60%.
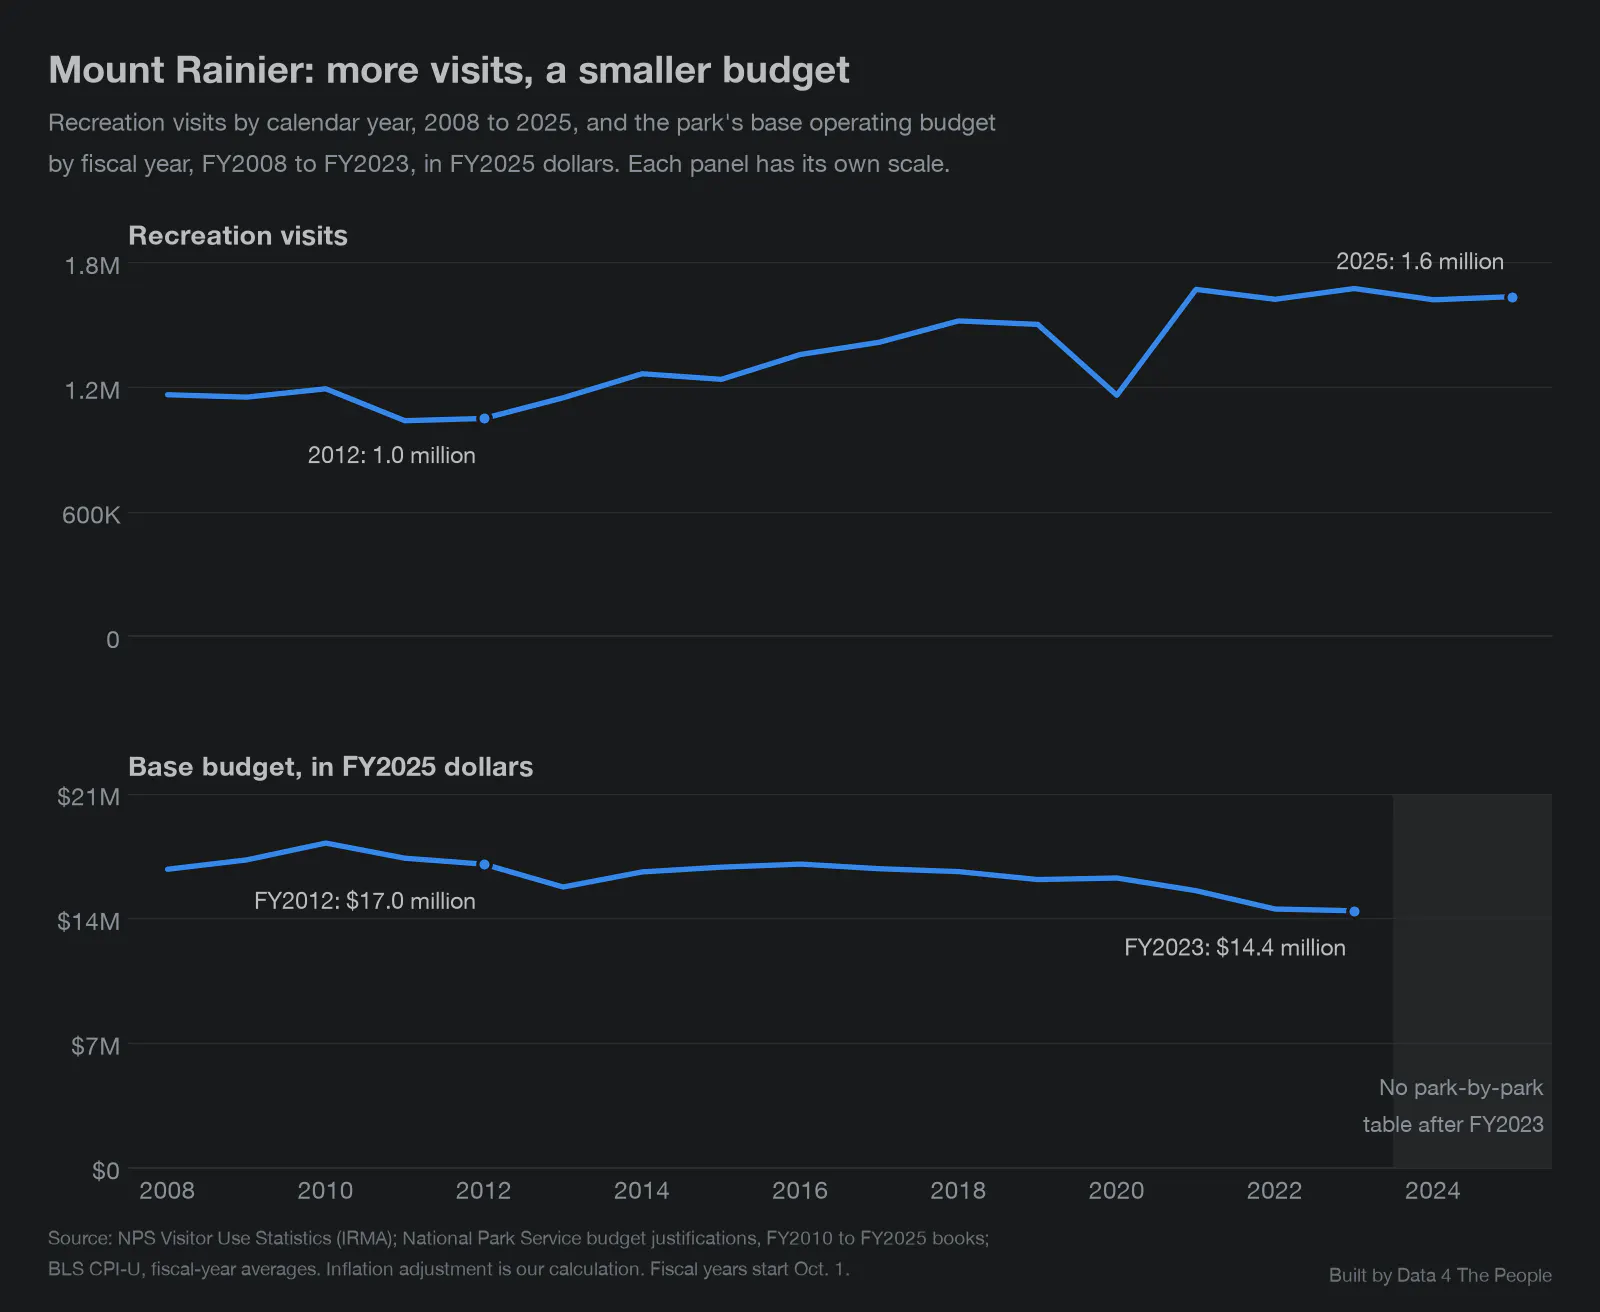
Sources: NPS Visitor Use Statistics; NPS budget justifications; BLS. Inflation adjustment is our calculation.
Dividing the budget by the visits shows the combined effect. In FY2012, Mount Rainier had $16.24 of base budget for each recreation visit, in FY2025 dollars. By FY2023, it had $8.61, a drop of 47%. The next chart shows each year.

Our calculation: base budget divided by recreation visits. Sources: NPS Visitor Use Statistics; NPS budget justifications; BLS.
What happened to the FY2026 Green Book? It apparently borrowed some magic from the parks it’s supposed to detail and magically never appeared. According to the Congressional Research Service, "NPS did not release a budget justification for FY2026." The Senate Appropriations Committee said the same thing in its July 24, 2025, report: it "has not received the detailed budget justification for the National Park Service for fiscal year 2026."
The FY2027 book did come out, in April 2026. However, it is just 219 pages long, compared with 639 pages for the FY2025 book. It does not have the park table, and it does not have the section on park visitation and acreage that the FY2025 book had.
Congress did ask for park-level numbers in another form. The explanatory statement for the final FY2026 spending law, printed in the Congressional Record on January 8, 2026, directs the Park Service to brief the appropriations committees every 60 days on "staffing levels by park and visitor data by park." Those briefings go to the committees only. We looked for a public copy and could not find it.
What the record we have shows
Across the 63 national parks, visits rose from 71.1 million in 2012 to 93.9 million in 2025, an increase of 32%. Visits rose at 52 of the 63 parks.
In other words, I am not alone in my love for this country's national parks.
However, budgets moved the other way once inflation (as measured by CPI-U) is counted. We compare 61 budget lines, which cover 62 of the 63 parks. From FY2012 to FY2023, the total base budget on those lines rose 16% in dollars. Prices rose 32% over the same years. After adjusting for inflation, the total fell 13%, from $653 million to $571 million in FY2025 dollars.
The chart below shows the total both ways: as published, and after inflation.

Sources: NPS budget justifications; BLS. Inflation adjustment is our calculation.
That drop was broad. Base budgets fell after inflation on 60 of the 61 budget lines, and the median line fell 12%. The one exception was Dry Tortugas, up 4%. The largest drops were at the National Park of American Samoa (39%), Congaree (23%), the North Cascades line (20%), Lassen Volcanic (18%) and Channel Islands (17%).
The chart below shows the change after inflation for every budget line, from FY2012 to FY2023.
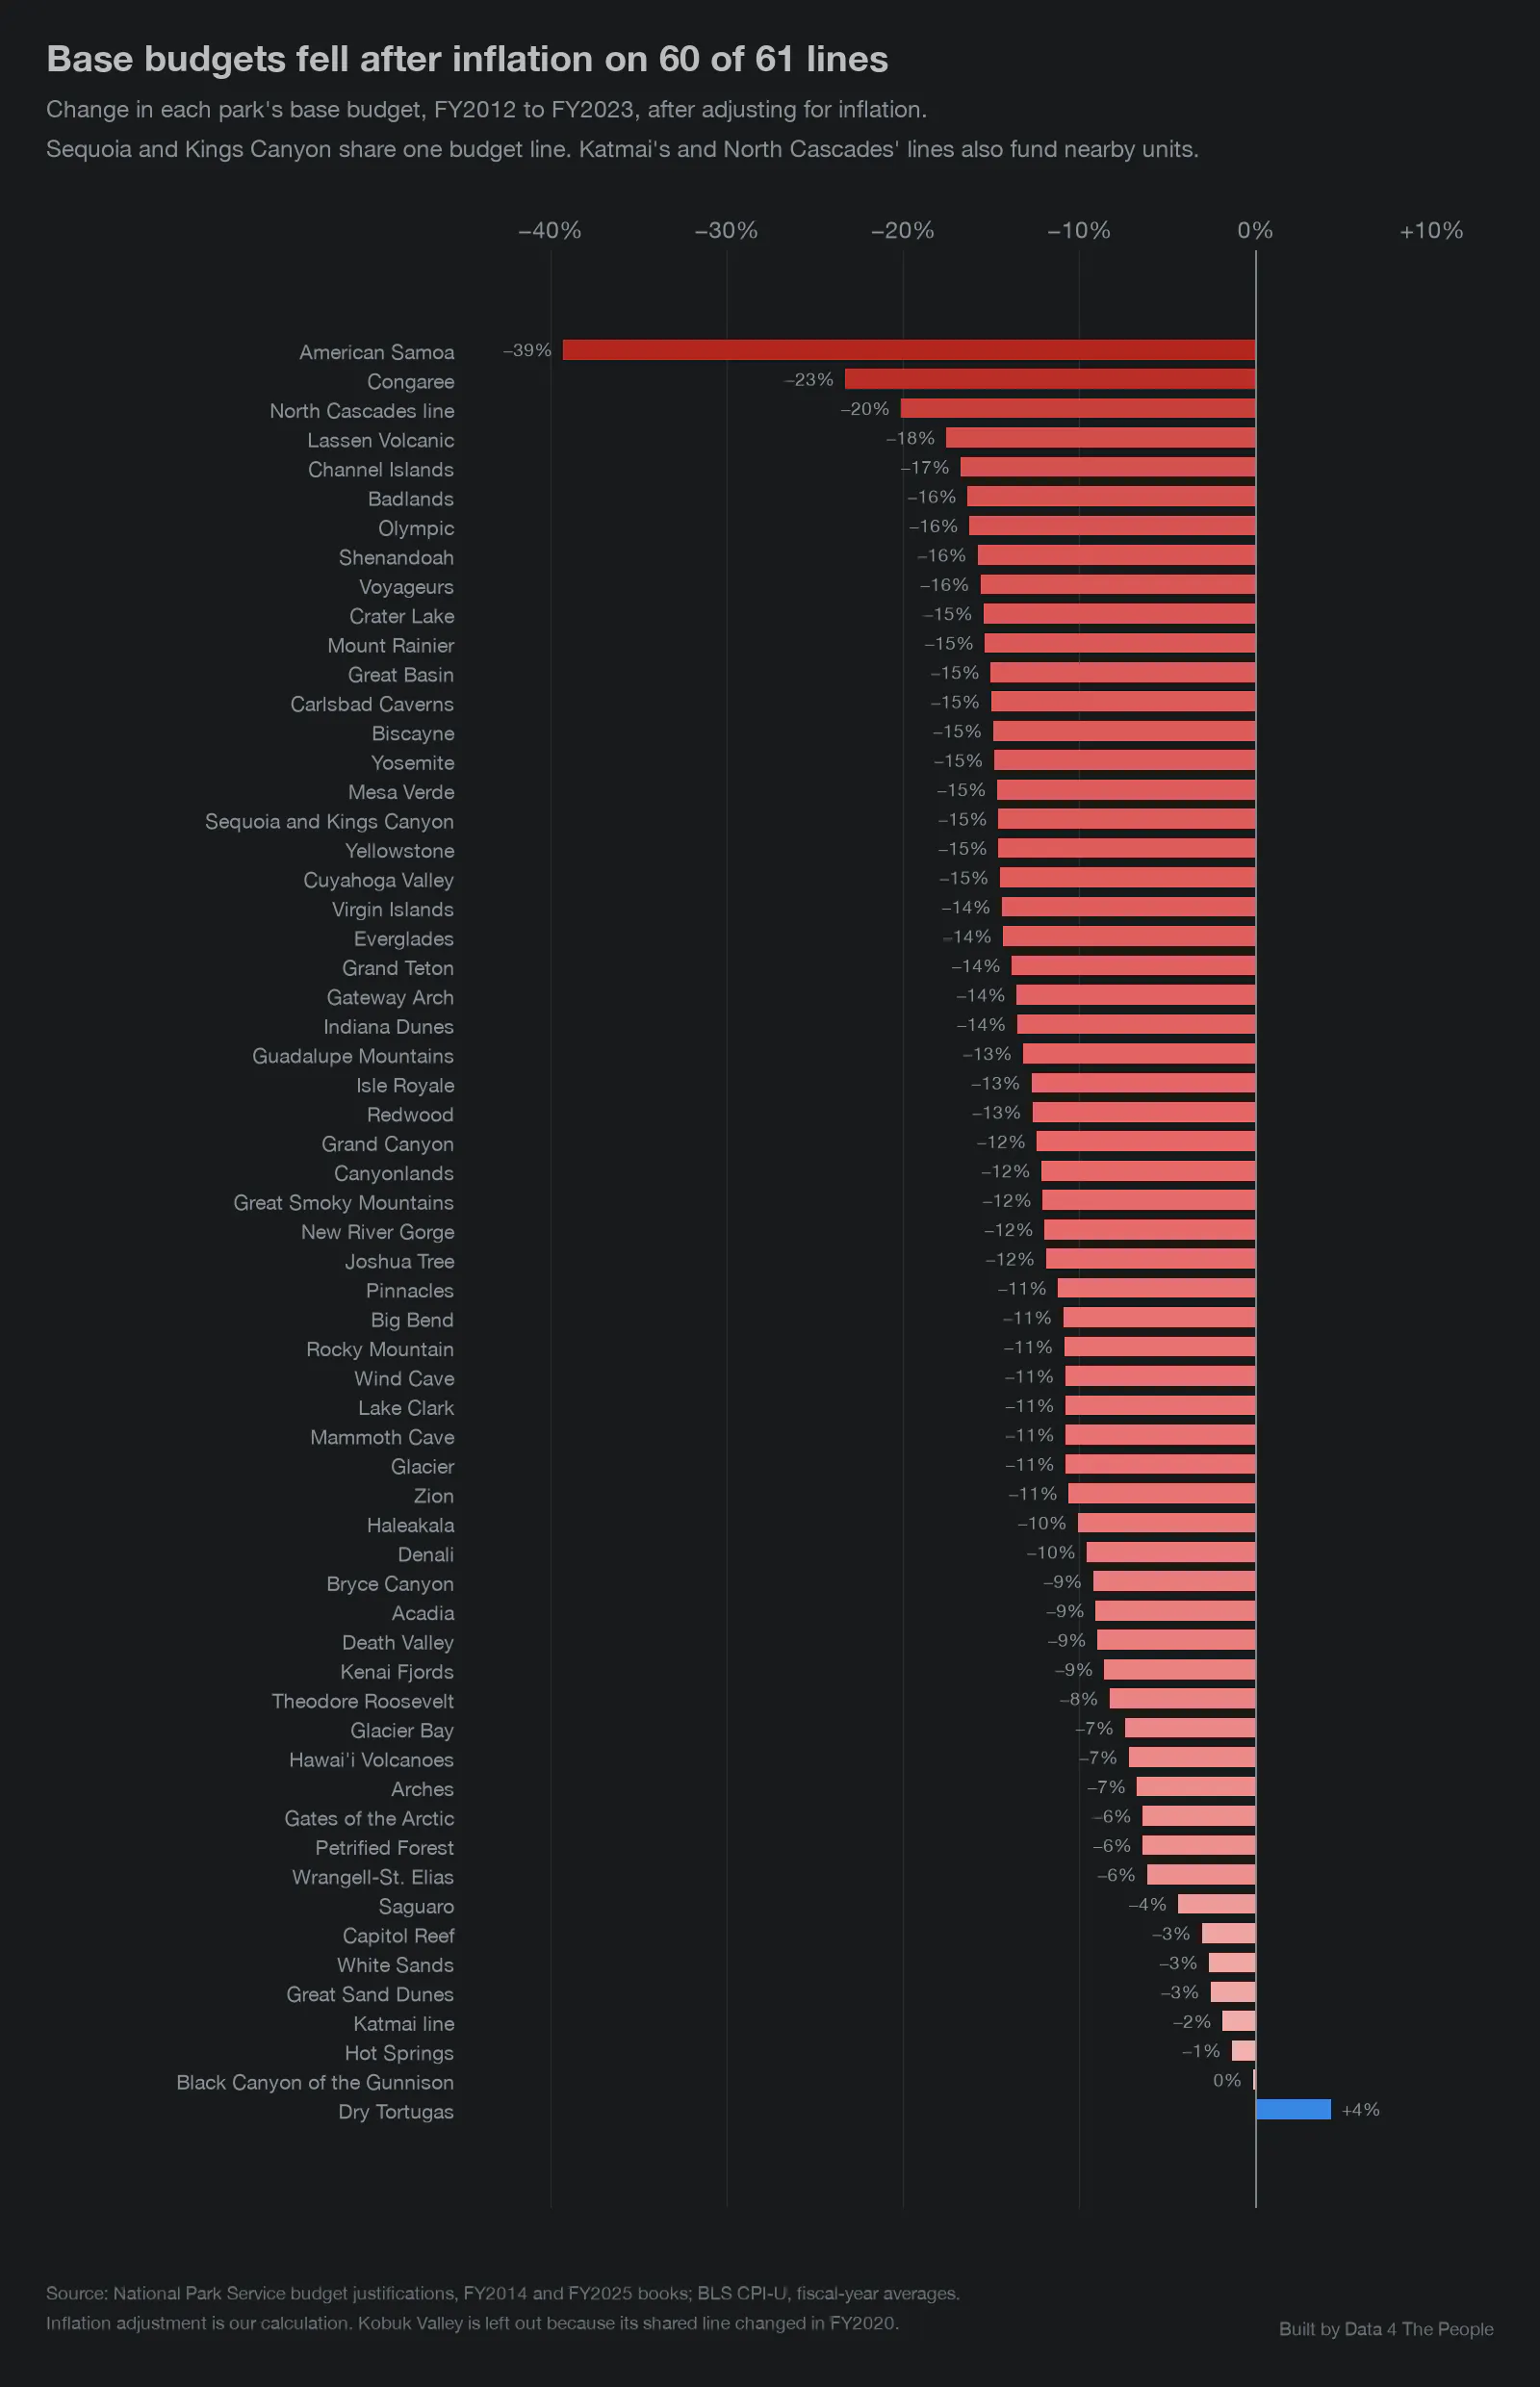
Sources: NPS budget justifications; BLS. Inflation adjustment is our calculation.
Of the 58 parks with their own budget line, 48 had more visits in 2025 than in 2012 and less buying power in FY2023 than in FY2012. The data shows the two moving in opposite directions. It does not tell us why.
Staff fell too. Total staff on the 61 lines went from 7,642 full-time equivalents in FY2012 to 6,873 in FY2023, a drop of 10%. Staff fell on 51 of the 61 lines.
Here is total staff across the 61 budget lines for each year the table covers.

Our sum of the park figures. Source: NPS budget justifications, FY2010 to FY2025 books.
Fewer staff and more visits means each person on staff covers more visits. Across the 59 budget lines where we have visits for every park on the line, there were 10.5 staff for every 100,000 visits in FY2012 and 7.3 in FY2023, a drop of 31%. The chart below shows each year.

Our calculation: total staff divided by recreation visits. It leaves out Kobuk Valley and the Katmai and North Cascades lines, which also fund other park units. Sources: NPS Visitor Use Statistics; NPS budget justifications.
The budget table counts staff but does not say what they do. Federal workforce data from the Office of Personnel Management does, for the Park Service as a whole. These are the people who keep visitors safe, maintain the parks, study them and lead tours. OPM counts people, including seasonal staff, rather than full-time equivalents, and it covers the whole agency, so its numbers are much larger than the budget table's.
From September 2012 to September 2023, the last year of the park budget table, the agency's headcount fell 16%, from 25,776 to 21,583. Every job group with at least 500 people in 2012 got smaller. Maintenance and trades, the largest, fell 19%. Park rangers fell 15%, and guides and education 17%. The chart below shows each group.
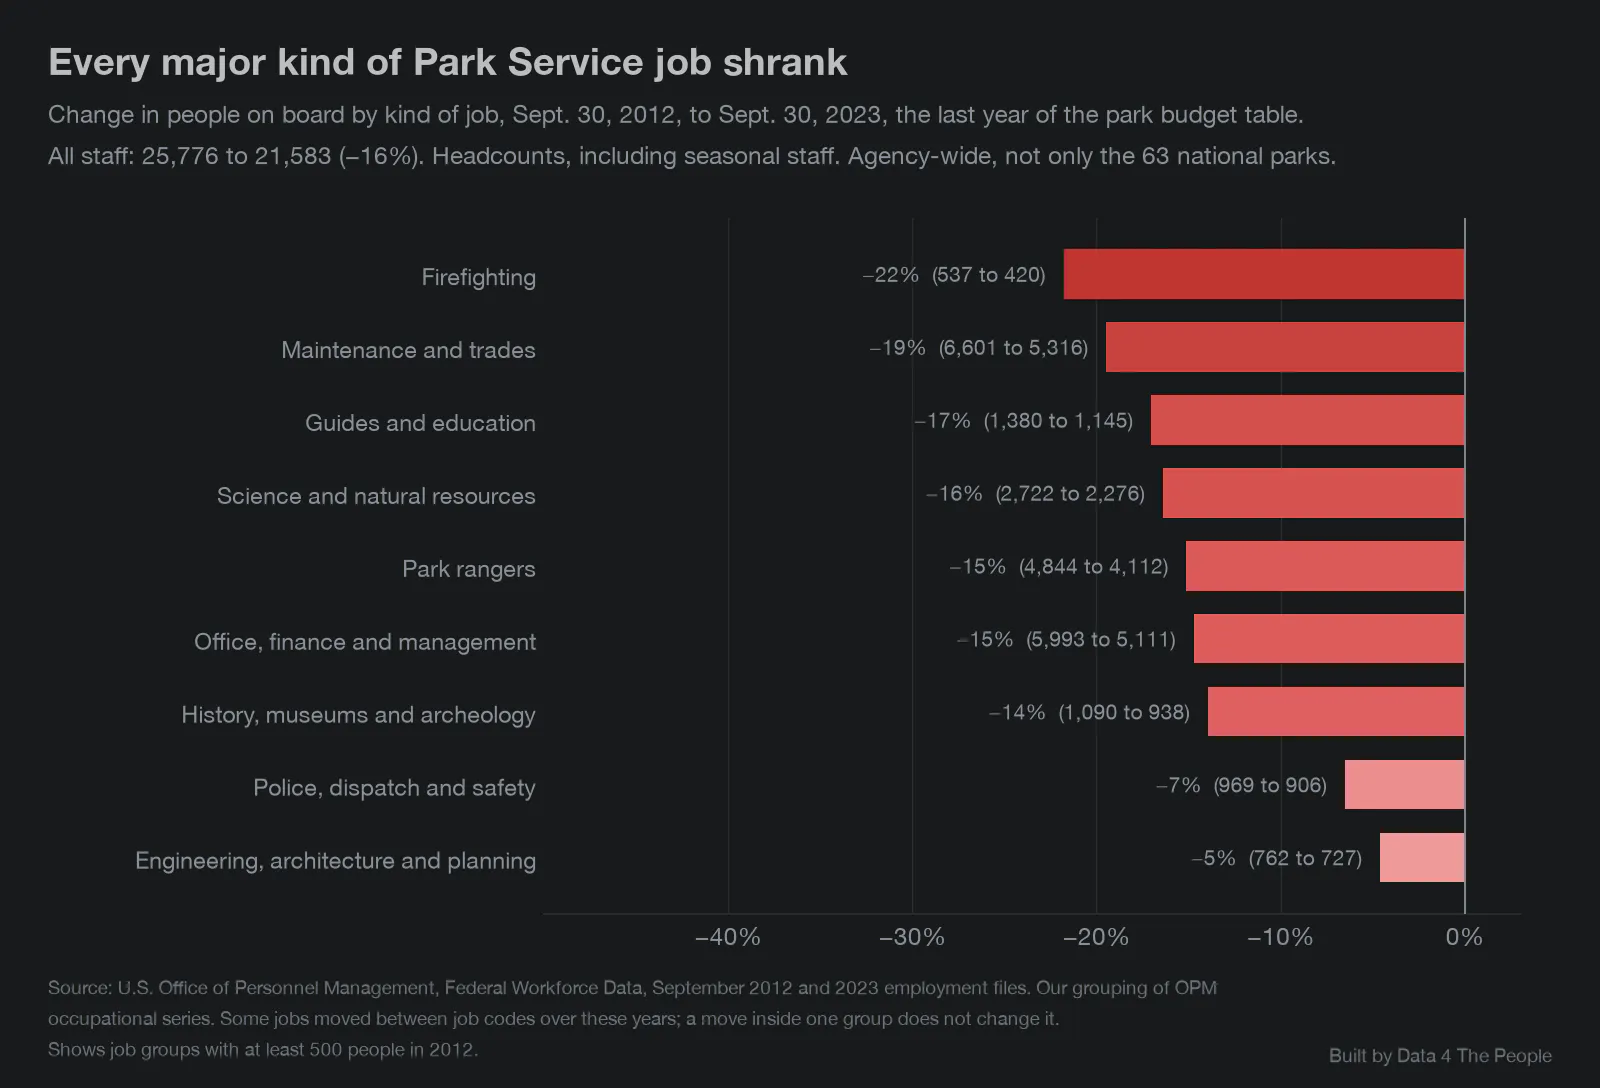
Source: OPM Federal Workforce Data, September 2012 and 2023. Job groups are our own, built from OPM job codes.
Over the same years, visits to all Park Service sites rose 15%, from 282.8 million in 2012 to 325.5 million in 2023. So on average, each worker now covers more visits. There were 91 people on board for every million visits in 2012 and 66 in 2023, a drop of 27%. Maintenance and trades went from 23.3 workers per million visits to 16.3, and park rangers from 17.1 to 12.6. The chart below shows each group.
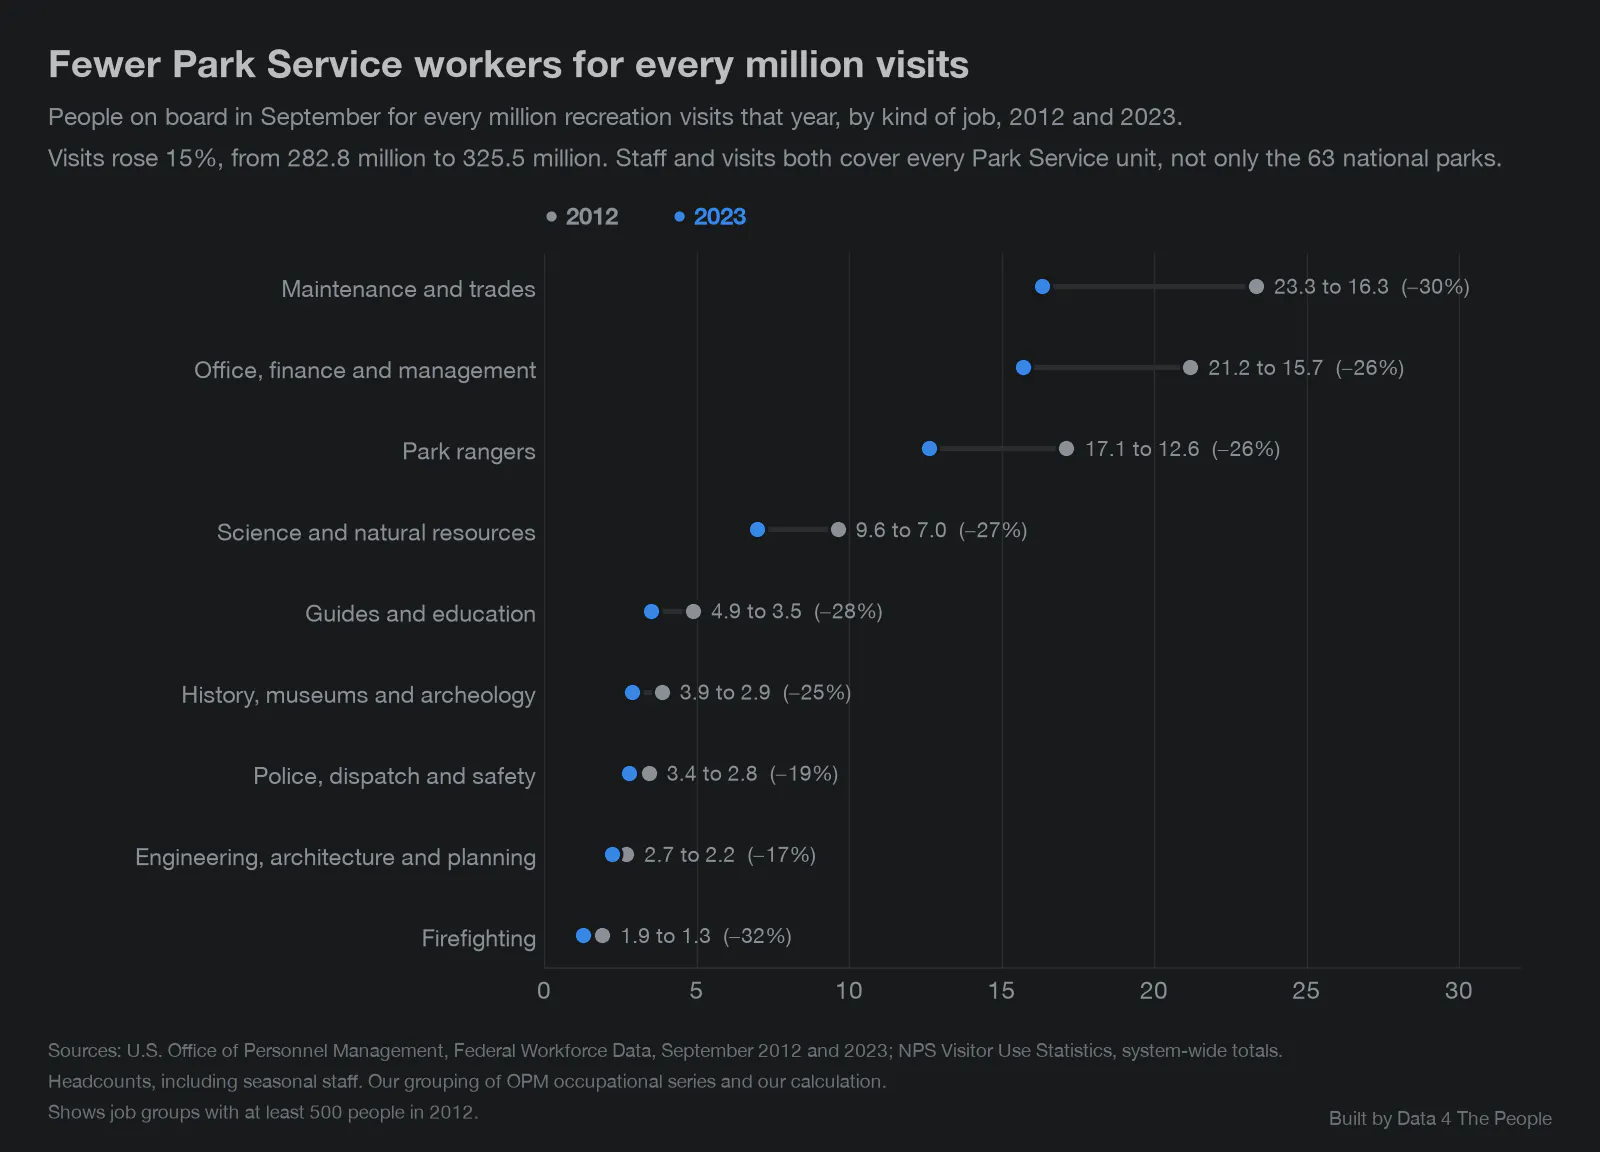
Our calculation. Sources: OPM Federal Workforce Data, September 2012 and 2023; NPS Visitor Use Statistics, system-wide totals.
Surprise! The table ends as the workforce changed
Why did the reporting stop? We do not know. But the timing lines up with a big change in the workforce.
The Government Accountability Office counted 18,096 Park Service employees on December 31, 2024, and 15,156 on December 31, 2025, a drop of 16%. Those counts cover the whole agency, not single parks.
A few parks post newer numbers on their own websites, but the reporting is uneven. Six of the 63 parks list a budget or staff figure for FY2024 or later. Each uses its own years and measures. Three give no year for their staff counts, and two replaced last year's figures with this year's, so we found the older ones only in the Internet Archive. Grand Canyon is the only park whose page today shows two years of staff counted the same way, and it shows a 14% drop in staff from FY2024 to FY2025. To be fair, these figures also do not always measure the same thing as the budget book, so we show them as notes in the tool and leave them off the charts.
The table below shows which years each of the six parks lists.
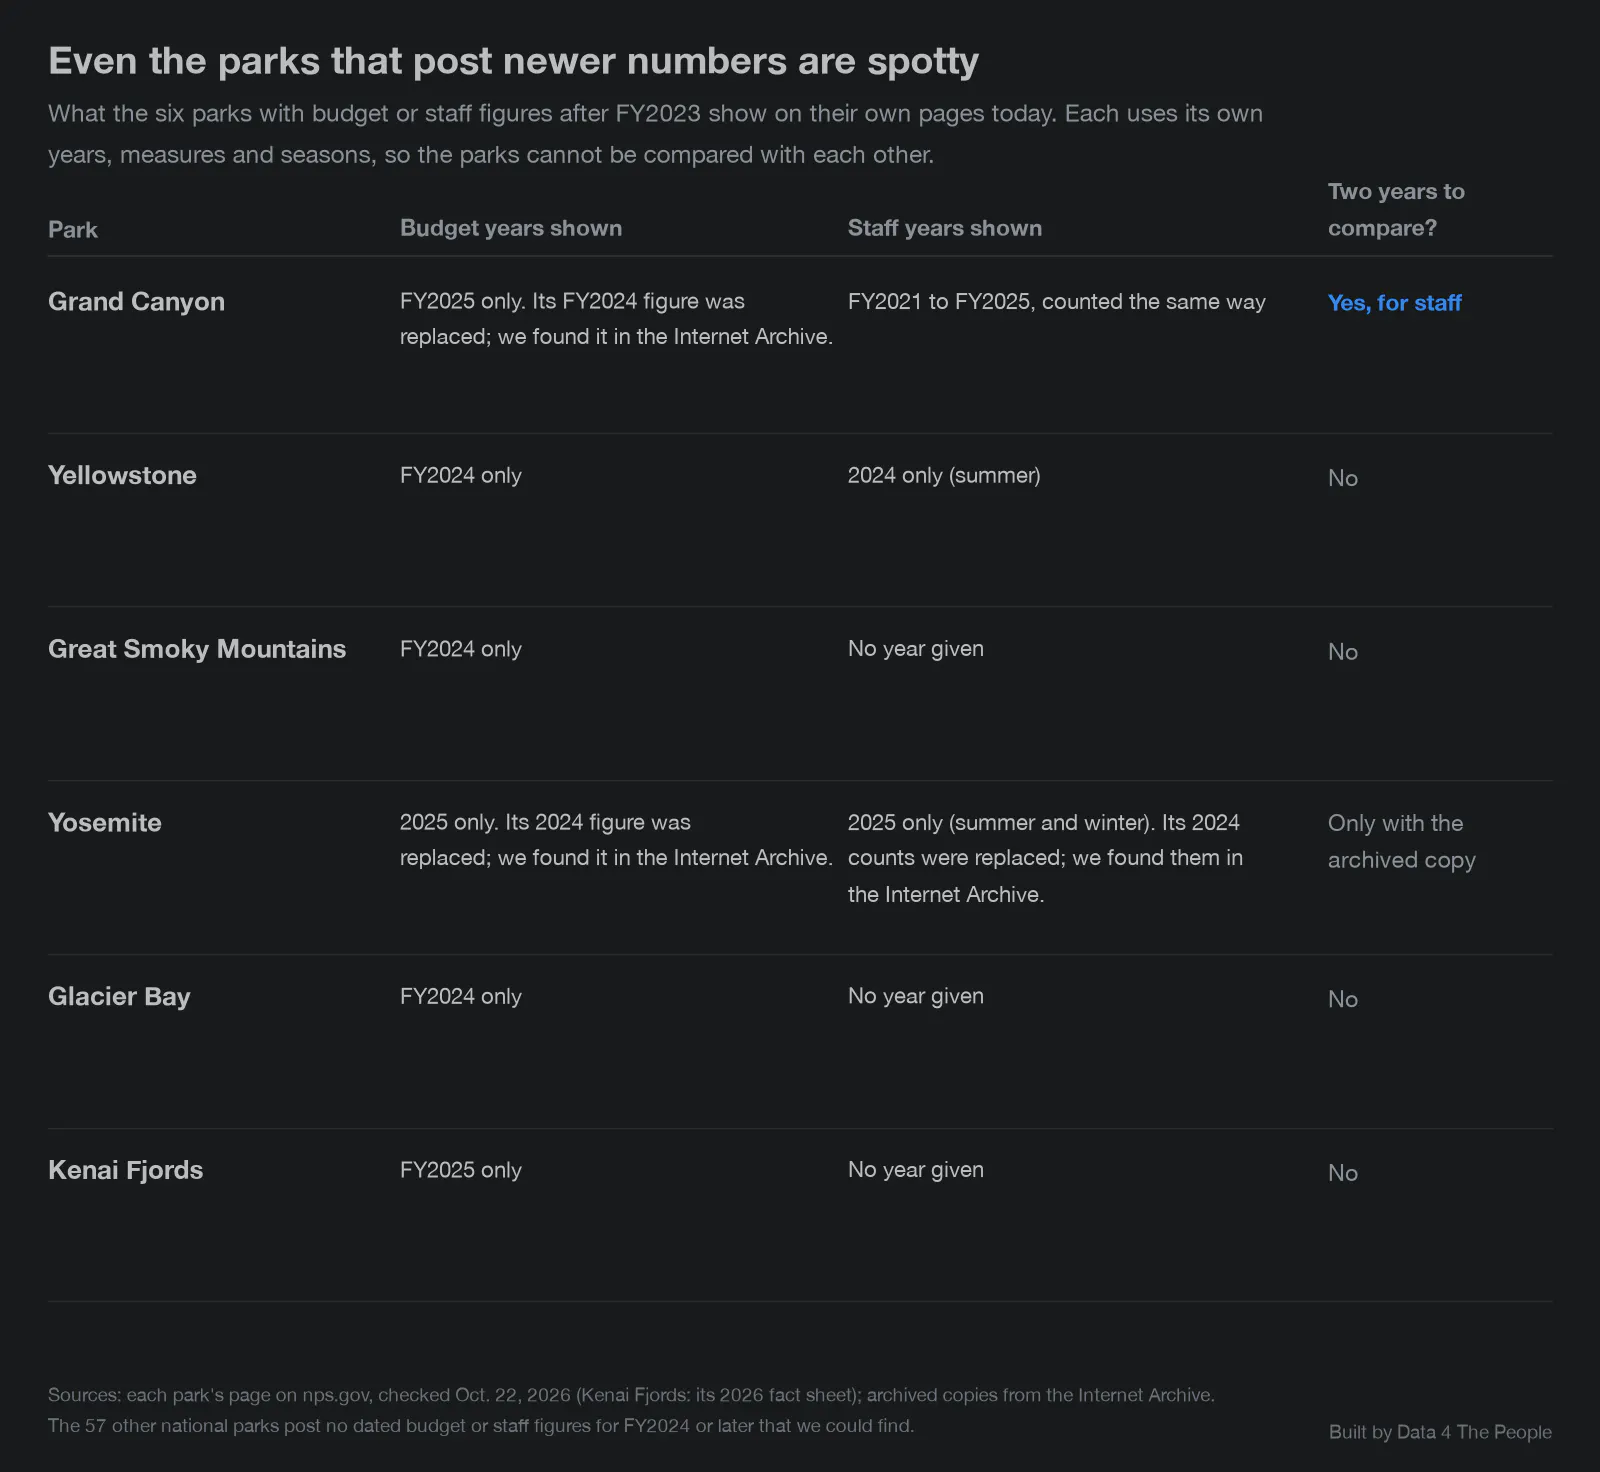
Checked October 22, 2026, on each park's page on nps.gov and in the Internet Archive.
It is not only the budget book
We found other park-level records that were taken down or replaced:
- Repair backlog by park. The Park Service's park-by-park reports on deferred maintenance for FY2014 to FY2018 now return "page not found" (archived copy). Its FY2024 fact sheets for each park were replaced with FY2025 versions. We found copies only in the Internet Archive, and for FY2024 only for 25 parks.
- Federal workforce data. The Office of Personnel Management retired FedScope, its public workforce database, on January 31, 2026, per its notice. It points users to a new site, which counts employees by duty station rather than by park.
- Yellowstone's staff count. The park's facts page listed "Full-time equivalent (FTE): 512" in early 2025. While it may not be an apples-to-apples comparison, this is down from 523 in the FY2023 budget table. That line was gone by May 2025.
We found no statement from the agencies explaining these changes, and we do not know why they were made.
The chart below shows, year by year, which park-level records the Park Service has published and where they can be found today.
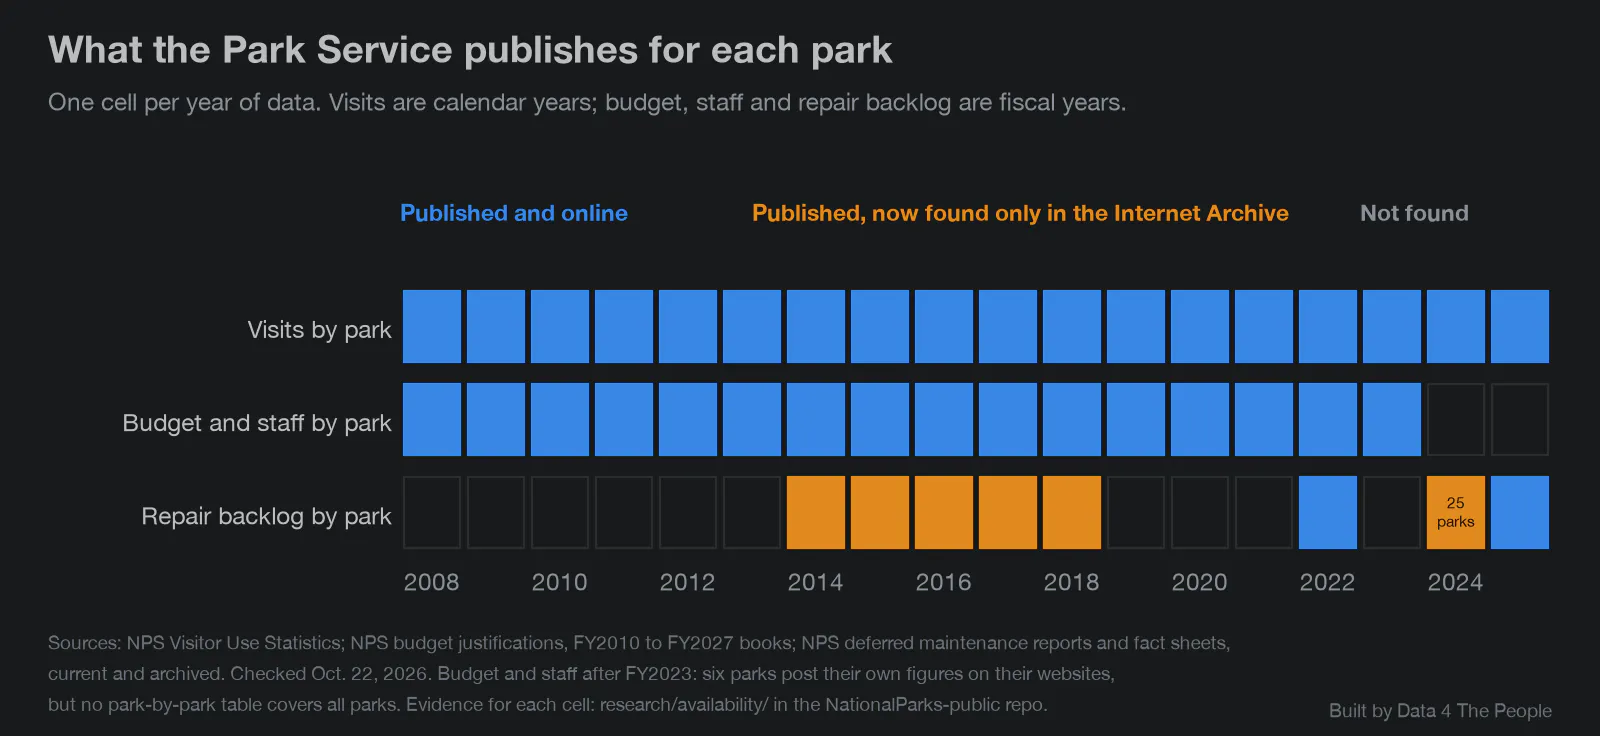
Checked October 22, 2026. Sources: NPS visitor statistics, budget justifications and deferred maintenance reports.
Where park-level numbers live now
Today, park-level staffing and budget figures sit in a few places, and none of them covers every park in the same way:
- Briefings to Congress, which are not public.
- OPM's new workforce data, which counts employees by duty station. A duty station is not the same as a park.
- Some parks' own websites, where a handful post their budget and staff.
The record up to FY2023 is still public, and it is all in the tool above. Pick your park and see what it shows.
When the data goes dark
I think that of all my fears for our society (and I have many at this moment), the destruction or hiding of data is paramount. Given Data 4 The People's purpose, that’s likely not a surprise.
But it’s deeper than that. Whoever holds the data holds the power. Look at the most powerful companies in the world. They are all data companies, or companies selling components to these companies. Data, used properly, is the source of the truth that can save us from ourselves. It is the basis for sound decision making. Don’t believe me? Ask any business operator how they make decisions on where to invest or how to run their business. They don’t use a Ouija board. They use data.
And so, as someone whose deepest moments of peace and awe have happened in these parks, it’s the ultimate insult when their data stops being shared with the public.
In other words, this is personal.
These are the places we go to get away from the chaos of the modern world and connect with something deeper (call it a soul if you want). But in one way, these places are less yours than they were. You may have access to them, but you no longer have access to the data - the power - to know that your tax dollars are being used to take care of them for generations to come.
Time for reflection
Ultimately, here is what I have realized from my last couple weeks of research.
It is time to look in the mirror and ask one question.
What matters to you?
Is it knowing we have emergency oil reserves in place when we need them?
Is it affordable gasoline and diesel prices that we have come to expect?
Is it your kids being able to own a home one day?
Is it the manufacturing job that pays well enough to support your family?
Is it the water that comes out of the faucet when you turn it?
Is it the abundance of food available to buy?
Or, is it knowing our national parks will be around for our grandchildren to visit?
We've written about all these things in just the last few weeks. Read our work. But if you don't, here's the key message - none of these things are guaranteed anymore. They all are at risk of fading away, unless we cut through the noise and do something.
So, I will leave you with that while I take the next week off to reflect. I plan to spend a lot more time on my local trails, knowing there is no guarantee how much longer they will be there for me to enjoy.
How we built this
- Visits are recreation visits from the Park Service's visitor statistics, summed by calendar year, 1979 to 2025. A visit is one person entering a park for recreation on one day, so one person on a three-day trip counts three times.
- Base budget and staff come from the park table in the 16 budget books for FY2010 to FY2025, which together cover FY2008 to FY2023. Base budget is a park's share of the Park Service's main operating account. It leaves out money from other accounts, such as construction, entrance fees, donations and Great American Outdoors Act projects. Staff is total full-time equivalents, which counts every position whatever money pays for it.
- Inflation. We convert budgets to FY2025 dollars with the Consumer Price Index (CPI-U), averaged over each federal fiscal year. Fiscal years start October 1.
- Budget per visit is our own calculation: a fiscal year's base budget divided by recreation visits in the calendar year with the same number. We show it only where the budget line matches the parks on it.
- Staff by job comes from the Office of Personnel Management's Federal Workforce Data, September 2012 and September 2023. We grouped OPM's job codes into plain job groups and show those with at least 500 people in 2012. For per-visit figures we divide by recreation visits to every Park Service site, since OPM's counts cover the whole agency.
- Two tie-outs. We recomputed every number on the page and in this post with our own code. A separate check then rebuilt 18 parks in full, and every park's visit history, from the original sources. Every source, rule and known limit is written down in our DATASETS.md file.
What this data does not tell you
- Counting methods change. Parks change how they count visits, sometimes in ways that move the totals a lot. Acadia's visits fell by more than half in 1990, the year it made a major change in how it counts. The tool marks these years with dashed lines.
- Some counts are known to be wrong. The Park Service says Bryce Canyon's visits for 2000 through 2024 were about 18% to 19% too high. It has not published corrected numbers, so we show Bryce as published and leave it out of the changes that compare those years with 2025. Without Bryce, the rise in total visits from 2012 to 2025 is still 32%.
- Base budget is not everything a park spends. Fees, donations, construction money and other accounts are separate, and their size varies a lot from park to park.
- Shared budget lines. Sequoia and Kings Canyon share one budget line. Katmai's and North Cascades' lines also fund nearby park units. Kobuk Valley has no budget figures in the tool because its shared line changed in FY2020.
- OPM counts people, not full-time equivalents. Seasonal staff are included, so a September count can differ from other months. OPM lists a duty station for each worker, not a park.
- The park budget table stops in FY2023, and visit counts in 2025. Preliminary 2026 visit numbers exist, but they are not final until early 2027, so we leave them out.
- The tool shows what happened, not why. A change in a park's numbers can come from many things at once.
Common questions
How much funding does each national park get?
The Park Service's budget books listed each park's base budget through FY2023. Across 61 budget lines covering 62 of the 63 national parks, the total was $571 million in FY2023, in FY2025 dollars. Our free map shows every park's budget, staff and visits by year.
Has national park funding kept up with inflation?
Not at the park level. From FY2012 to FY2023, park base budgets on 61 lines rose 16% in dollars, while prices rose 32%. After inflation, they fell 13%. Budgets fell after inflation on 60 of the 61 lines.
How much does each national park spend per visitor?
It varies by park. At Mount Rainier, base budget per recreation visit fell from $16.24 in FY2012 to $8.61 in FY2023, in FY2025 dollars, a drop of 47%. The map shows budget per visit for each park where the budget line matches the parks on it.
How many people work for the National Park Service?
The Government Accountability Office counted 15,156 Park Service employees on December 31, 2025, down 16% from 18,096 a year earlier. OPM's workforce data, which includes seasonal staff, counted 19,315 people on September 30, 2025.
How many park rangers does the National Park Service have?
OPM's park ranger job code counted 4,844 people in September 2012 and 4,112 in September 2023, a drop of 15%. That job code covers several kinds of ranger work, so it is higher than counts of law enforcement rangers alone.
Why did the Park Service stop publishing park budgets?
We do not know. The Park Service did not release a budget justification for FY2026, and its FY2027 book does not include the park-by-park table. We found no statement explaining the change.
Is there national park budget data after 2023?
Not for every park. Six of the 63 parks post a budget or staff figure for FY2024 or later on their own websites. Congress receives briefings on staffing by park every 60 days, but those are not public.
Support Data That Serves the Public
Data should empower people, not just institutions. Your support helps us create accessible research, visualizations, and tools that uncover economic inequality and inform better decisions.
Donate
Enjoying this post?
Tell others about it.
More articles like this
Fetching Related Posts
There are no other articles tagged with Visualization