
Public Health Is Losing a Measles Argument It Should Be Winning
Utah’s outbreak was foreshadowed in public data for a decade. The problem wasn’t a lack of evidence; it was who could see it.

Michael Kinch
Published
November 12th 2026
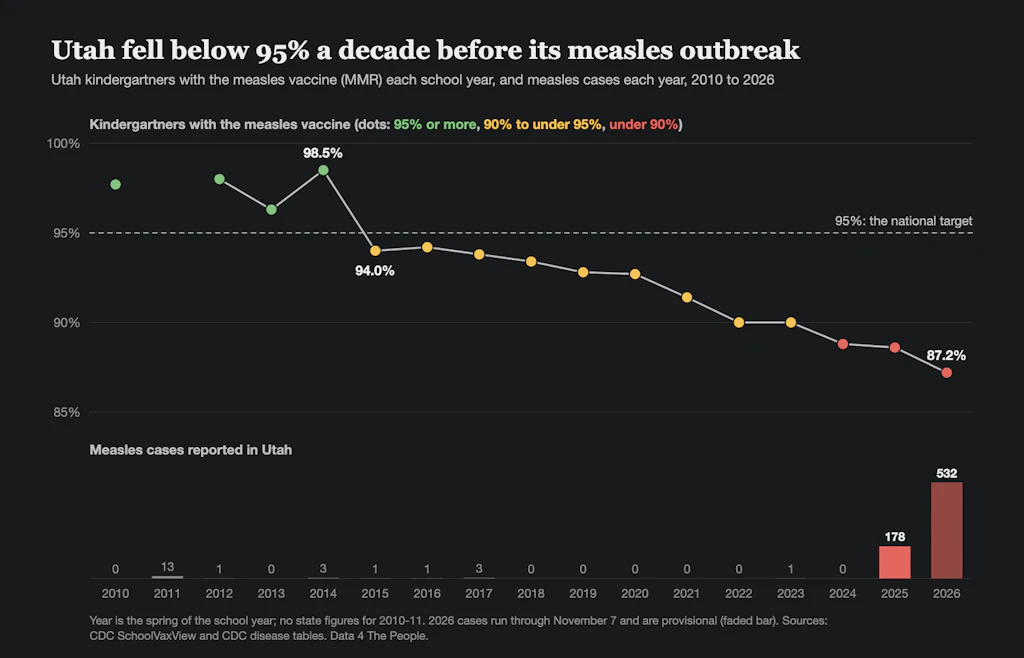
By 2015, the share of Utah kindergartners vaccinated against measles had slipped below 95 percent, the level of immunity needed to stop the virus from spreading. No alarm sounded. The figure appeared, as such figures do every year, in a state report and a federal data table. Then it slipped a little further the next year, and the year after that.
A decade later, Utah has the highest measles rate in the country, in the worst U.S. measles epidemic in more than three decades. Since June 2025, the state has recorded more than 700 cases. Nationally, states had reported 5,073 measles cases to the Centers for Disease Control and Prevention in 2026 as of Nov. 7, 150 percent more than the total for 2025. This week, a Pan American Health Organization commission is meeting to review whether the U.S. still meets the criteria for measles elimination, a status it earned in 2000. A decision is expected within days.
It is tempting to treat this as a story about misinformation alone. But it is also a story about a failure inside public health. This is not a failure of evidence, but of communication. The warning was public all along. Almost no one in a position to act on it saw it.
In a grim sense, measles is the most legible of infectious diseases. In a population with no immunity, one infected person passes the virus to 12 to 18 others, on average. Because the virus is so efficient, a community’s vaccination record is close to a forecast. Each school year in which fewer than 95 percent of entering kindergartners are vaccinated adds another cohort of susceptible children. Older, better-protected cohorts mask the deficit for a while. But unvaccinated children cluster in particular schools, congregations and neighborhoods, and within those clusters immunity can sink far below what a statewide average suggests. When the virus finally arrives, often with a single traveler, it finds the gaps.
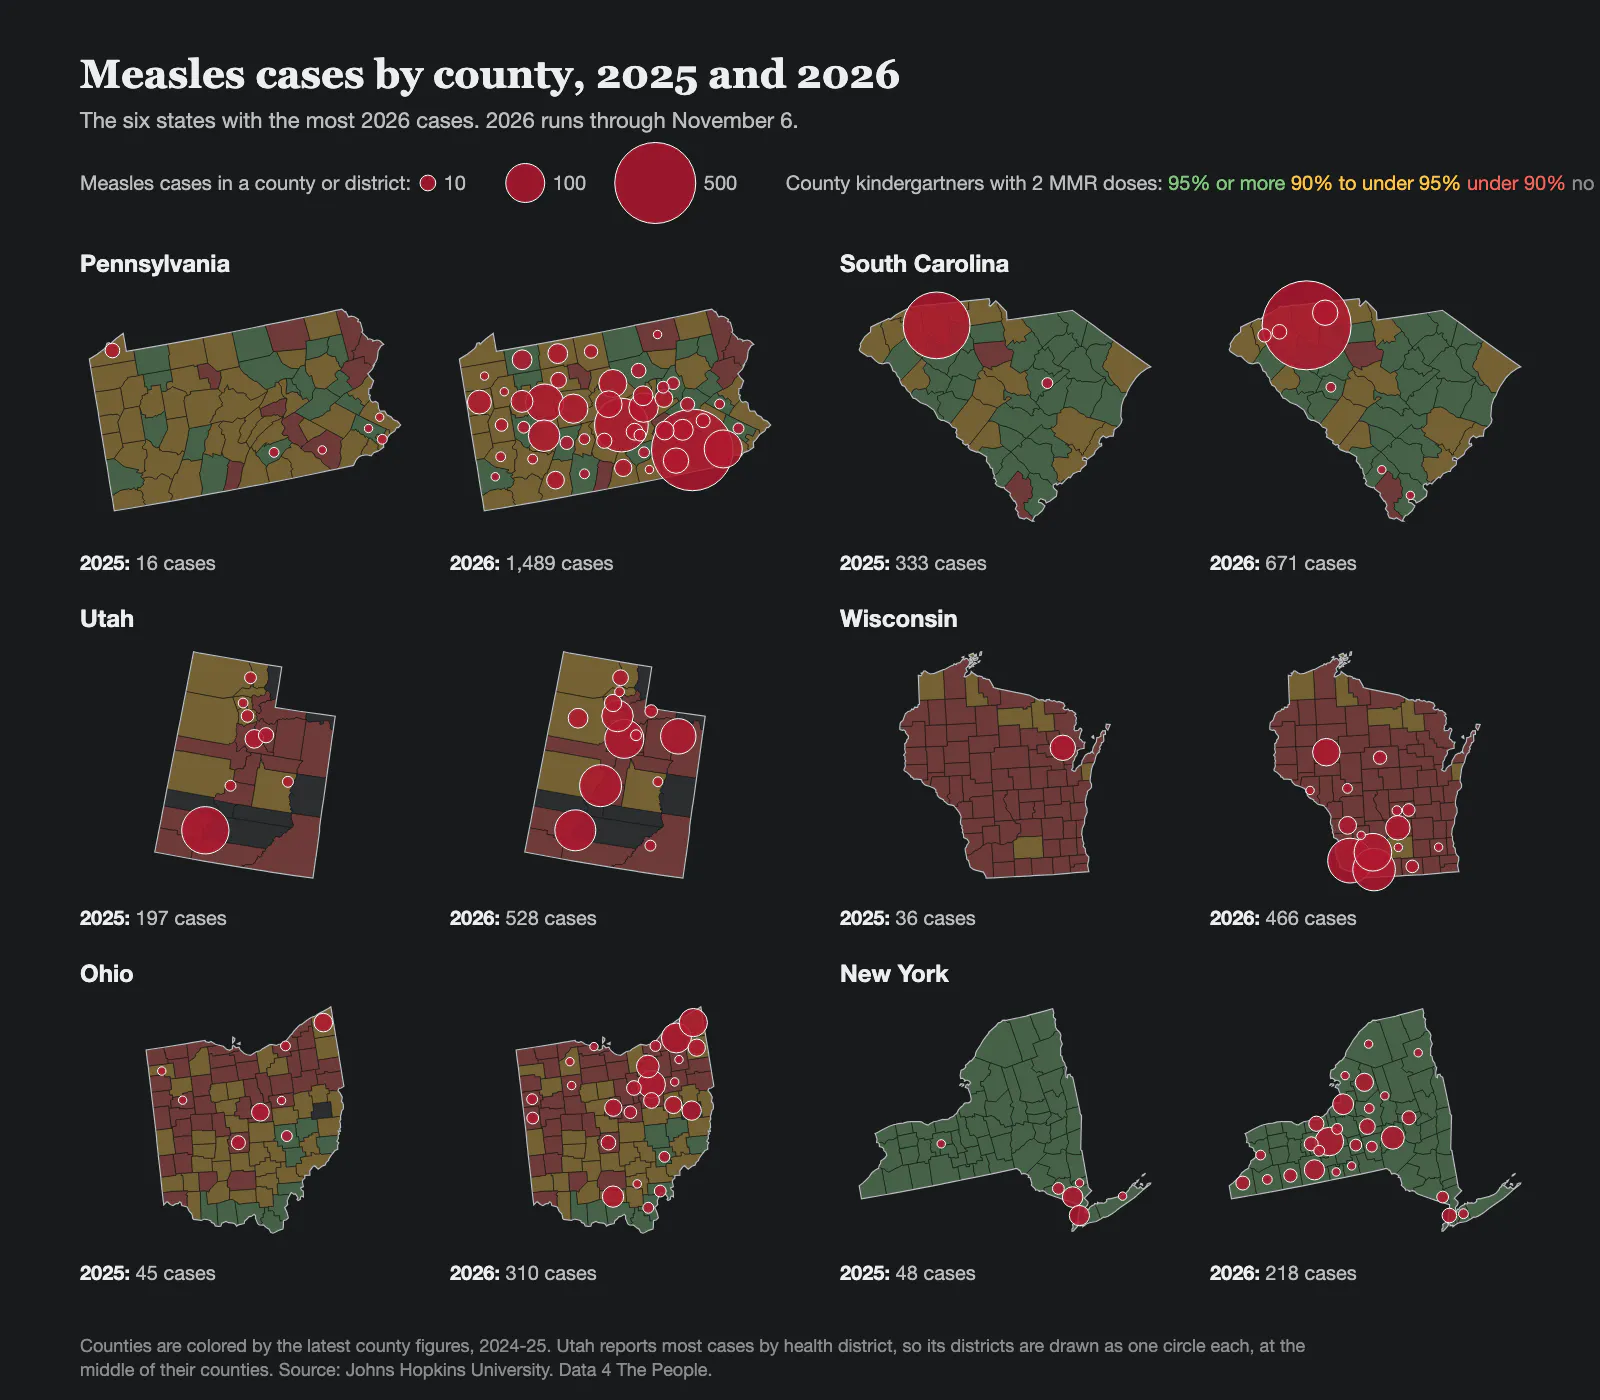
Measles cases by county in the six states with the most 2026 cases, 2025 and 2026. Counties are shaded by their latest kindergarten MMR rate, 2024-25. Utah reports most cases by health district, so each district is one circle. Source: Johns Hopkins University; 2026 runs through November 6.
By the 2025-26 school year, only 87.2 percent of Utah kindergartners had received their measles, mumps and rubella vaccines, and 12.2 percent held nonmedical exemptions. In Washington County, in Utah's southwest corner, 79.2 percent were vaccinated in 2024-25. Idaho is further along the same path, with 75.2 percent coverage and 17 percent of kindergartners exempted for nonmedical reasons.
None of these numbers is hidden. States collect them every year, and the CDC publishes them. But they live in spreadsheets and technical reports, expressed in terms like “herd immunity threshold” that mean little to a parent deciding about a vaccine, a school board member reviewing exemption policy, or a reporter at a local paper. Meanwhile, vaccine opponents have mastered the forms that actually reach people: short videos, personal testimonials and emotionally vivid claims that travel effortlessly across social media. Public health has, in effect, been holding the stronger evidence and losing the argument anyway.
That gap prompted our project. Liam Aranda-Michel, an MIT undergraduate, asked a deceptively simple question, “Why is there no single place where an ordinary person can watch vaccination rates and disease rise and fall together?” Working with Data 4 The People, a nonprofit that curates public data sets and turns them into tools for nonspecialists, we built a free, open map that sets a century of state-level cases of vaccine-preventable diseases against childhood vaccination coverage.
Nothing on the map will surprise an epidemiologist. The heavy toll of the early 20th century, the steep collapse in cases after vaccines arrived, and the recent erosion of coverage are all well documented. What is different is who can see it. A local reporter can pull up her own state and compare it with Utah a decade ago. A parent can see what measles meant for their grandparents’ generation without taking anyone’s word for it.
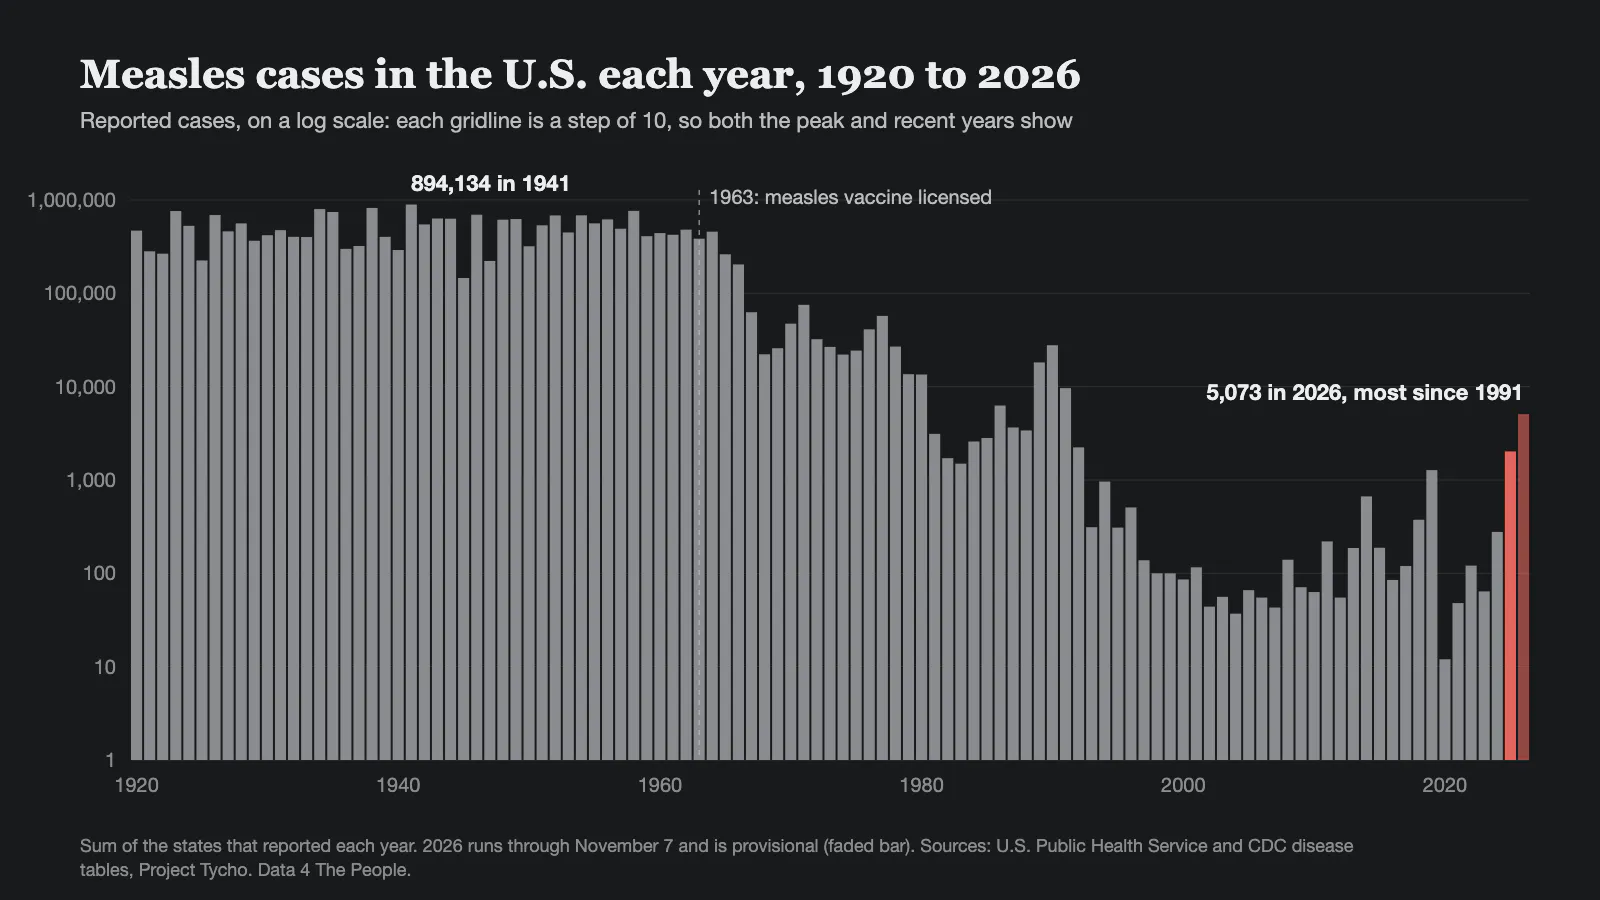
Reported measles cases in the U.S. each year, 1920 to 2026, on a log scale. The measles vaccine was licensed in 1963. Sources: U.S. Public Health Service and CDC disease tables, Project Tycho; 2026 runs through November 7 and is provisional.
That kind of access matters most locally, where trust is highest. Americans consistently report more trust in their own doctors than in national institutions. Physicians are best placed to communicate messages of an abstract threshold nature.
This assumes of course that these clinicians have the numbers in a form they can use. That is a goal of our present project: we provide the data and its implications, and allow a skeptical user to question how we came to those outcomes.
Such tools have limits. Whether and when the virus reaches a community is partly chance. State-level data hide local variation, and reported coverage can lag behind reality. Nor will data alone persuade a parent who has decided vaccines are dangerous; in one randomized trial, corrective messages about vaccine safety actually reduced vaccination intentions among the most hesitant parents. Yet open data can equip the people those parents trust, namely pediatricians, school nurses, local journalists.
Open data can also change the timing of public attention. If a small team with no funding for this project could assemble this picture in a few weeks, health departments with far greater resources could track these signals routinely, targeting catch-up vaccination where coverage is lowest before an outbreak rather than after. Reporters could tell the story of a community’s growing vulnerability while there is still time to change its ending.
Measles is the canary: the most contagious of the vaccine-preventable diseases, and the first to return when coverage slips. Whooping cough and mumps tend to follow, and the map tracks them too.
Two centuries of vaccine history show that resistance to vaccination never fully disappears. The past decade in Utah shows something else: its consequences are visible long before they arrive. The question is whether anyone is looking.
The charts in this essay come from Data 4 The People's free interactive map of infectious disease and vaccination by state, 1920 to 2026, built from CDC, U.S. Public Health Service and Johns Hopkins University data.
Support Data That Serves the Public
Data should empower people, not just institutions. Your support helps us create accessible research, visualizations, and tools that uncover economic inequality and inform better decisions.
Donate
Enjoying this post?
Tell others about it.
More articles like this
Fetching Related Posts
There are no other articles tagged with Data 4 Thought