
The Data Led Us to Lexington
Our rental affordability map pointed us to a county in Nebraska. A 1997 study had already told the first part of its story. We brought it up to date the year the beef plant closed.

Eric Pachman
Published
October 14th 2026
Last week, we released our Rentals Within Reach data visualization, which compared the median renter income to the rental stock for all U.S. counties. At the time, we said we would come back to this work several times with stories that we believe must be told. A visualization is just data. But it allows us to find stories that are needles in a haystack – very real stories of U.S. communities. We must do this work because the story is what makes this stick.
So today, we tell the story of Dawson County, Nebraska, home of Lexington.
Why Dawson County? Because in the 2020-2024 ACS 5-year census data (the most recent data we could use in Rentals Within Reach), Dawson County had the second-best rental affordability (90% of all units within reach at the median renter income) of all counties in the country with more than 1,000 rental units and reliable income data. The top county? Greenlee County, Arizona, home to a Freeport-McMoRan copper mine.
I was specifically looking across the list of most affordable counties because I am enamored with the idea of solutions data journalism. Can we use data tools to find favorable outliers, and then study why they are outliers? Maybe some of these counties have come up with ways to incentivize the build out of low-income housing? If we can find examples of this, maybe we can highlight what’s working for other areas to copy.
That was the intention behind today’s work. Greenlee County couldn’t be copied (they just happen to sit on a large copper deposit) so I moved down the list to Dawson County.
When I started to research Dawson County, I was hoping to find some evidence of any policies or incentives for low-income housing. I didn’t find that. But there are two sides to this equation. Higher incomes could make rentals more affordable, and I did find this. In the 2020-2024 ACS data, the median Dawson County renter household made $59,031, considerably higher than the $40,678 in Lincoln County due west. Maybe this was a story of a strong local employer who built roots in this community, boosting wages and standards of living.
Dawson County, Nebraska was that story, and Tyson was that employer… until January 20, 2026, when Tyson shut the doors on its meatpacking facility, cutting about 3,200 jobs and sending the county into an economic crisis.
In other words, the good news story I was expecting from the data ending in 2024 turned into a nightmare in 2026.
This is Dawson County’s story. But it’s more than that. It’s a story of America, of immigration, and of how one decision can alter the fate of an entire community.
Before the beef plant
Lexington is the county seat of Dawson County and its largest town. It began as Plum Creek, a stage and Pony Express stop on the south side of the Platte River. The Union Pacific Railroad came through in 1866, and the settlement moved north of the river to meet it. The county was organized in 1871, the town was laid out in 1873, and in 1889 residents voted to rename it Lexington.
In 1975, Sperry New Holland opened a factory there to build combines. By 1981 it employed about 900 people, according to Nebraska Public Media.
The factory closed in 1985, during the farm crisis. The Nebraska State Historical Society puts the loss at 940 jobs and a payroll of more than $16 million. Lexington had 7,040 residents in the 1980 census and 6,601 in 1990, a drop of 6%. Dawson County lost 11% of its people over the same ten years.
A plant too big for the town
In November 1988, Nebraska Gov. Kay Orr announced that the beef packer IBP would buy the empty combine factory and turn it into a beef plant. The company projected 1,200 to 1,300 workers and a payroll of $24 million a year. It began slaughtering cattle on November 8, 1990.
The plant passed that projection quickly. IBP reported 2,030 workers by February 1992, and the plant had about 2,300 by 1997. The whole town had 6,601 residents when it opened.
Much of what is known about those first years comes from a 1997 study by Lourdes Gouveia of the University of Nebraska-Omaha and Donald Stull of the University of Kansas, published by the Julian Samora Research Institute at Michigan State University. IBP would not release data on its workforce. But each new hire filled out a tax credit form, and the state job office in Lexington let the researchers read every form from November 1990 through July 1992. They also interviewed 66 Latino heads of household who had moved to town since the plant opened.
Here is what they found.
- There were few local workers to hire. Unemployment in the area was about 3% when the plant came. IBP told the town it would hire a good portion of its workers locally and look elsewhere "as a last resort."
- The local supply ran out. The study says that given the plant's size, the small local labor pool and high turnover, "IBP rapidly runs through the local supply of willing workers."
- The hires came from farther and farther away. At startup, more than 60% of new hires had a Social Security number issued in Nebraska. By the summer of 1992, 28% did.
- The company recruited out of state. It paid bonuses to workers who brought in a new hire, ran ads in other meatpacking towns, and sent recruiters on the road. California and Texas together supplied about one-quarter of hires over time, and the study says "IBP actively recruits in these states."
- Who was hired changed. Going by surnames on the forms, non-Hispanic workers were 81% of new hires at startup and 37% by mid-1992. Hispanic workers went from 18% to 57%.
The 66 interviews fill in who the newcomers were. Of those household heads, 62% were born in Mexico, 24% in Guatemala and 11% in the United States. For 41% of them, the last job had been in California. More than three-quarters had last worked in the food industry, in farm fields, kitchens or other packing plants. Asked why they left that job, the most common answer was that it did not pay enough. And 81% said they heard about the job in Lexington from a friend or a relative.
We reported a national version of this in August, in The Men Who Vanished: as foreign-born men left the U.S. workforce in 2025 and 2026, native-born men did not take the jobs they left. Lexington is one more case, not proof. The study measured who was hired, not who turned the work down.
Hard first years
The same study shows how rough the start was.
- Few people stayed. Over the plant's first 21 months, turnover totaled 250% against a workforce of about 2,000. In less than two years IBP hired and let go a number of workers equal to 76% of Lexington's 1990 population. Most of them quit. Of the 1,200 who left in the first nine months, 12% were fired.
- People arrived with nowhere to stay. A shelter called Haven House opened in January 1991. Through July 1992, 834 adults and 93 children stayed there at least one night.
- There was not enough housing. The town's plan called for 334 new units. By 1992 its consultants said the need was twice that.
- The schools filled up. Enrollment went from 1,558 students in May 1990 to more than 2,238 by the end of the 1995 school year, an increase of 44%.
The town that came out the other side
Enough of the newcomers stayed that the town grew. The chart below shows the population of Lexington and Dawson County in each census, with the two plant dates marked.

Lexington went from 6,601 residents in 1990 to 10,011 in 2000. Dawson County grew 22% over the same ten years. Source: U.S. Census Bureau.
The next chart shows the share of Lexington residents who reported Hispanic or Latino origin in each census, with a line where the plant opened.

The 1990 census was taken seven months before the plant opened. Source: U.S. Census Bureau.
Newcomers began to buy homes early. The 1997 study counted Hispanic surnames among Dawson County home buyers: 23 of 500 sales in 1992 and 50 of 518 in 1993.
Tyson Foods bought IBP in 2001. In the 2020-2024 census survey, about 830 Lexington residents were born in Africa, give or take 200.
The chart below compares the town with the county, the state and the country on three measures from that survey.
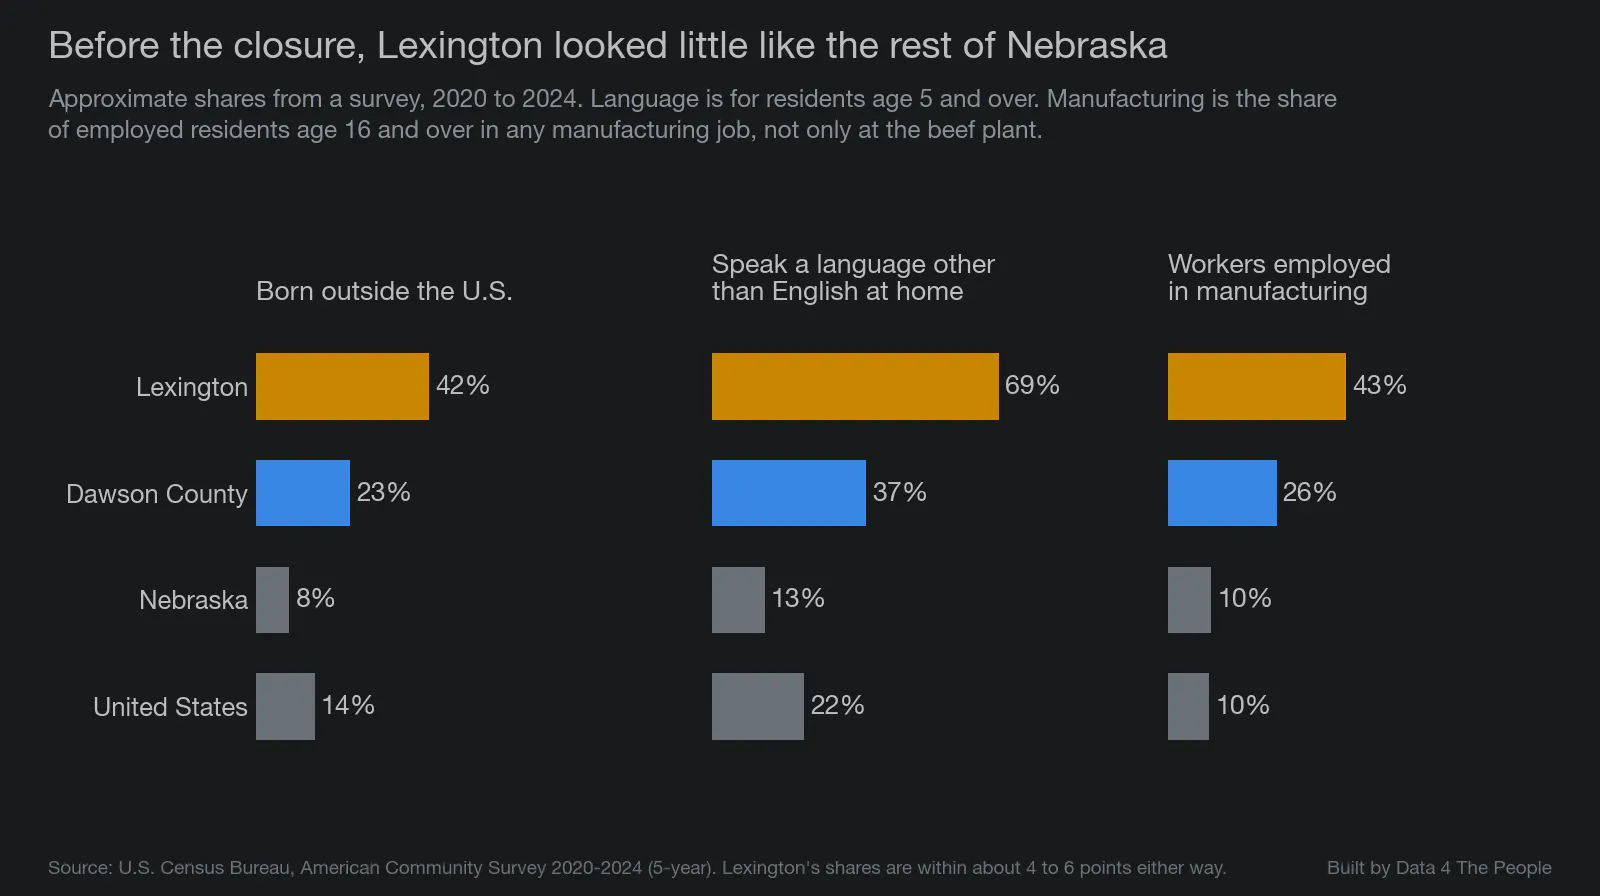
Survey estimates for 2020 to 2024. Lexington's shares are within about 4 to 6 points either way. Source: U.S. Census Bureau, American Community Survey.
About 57% of Lexington households owned their home. The median renter household in Dawson County made $59,031, the number that put the county near the top of our map. School officials told the Associated Press that nearly half of Lexington's students had a parent who worked at the plant.
The plant's 3,212 positions were equal to about 27% of all the jobs located in Dawson County in March 2025. That share is our own calculation, from the layoff notice Tyson filed and a federal count of jobs.
Why Tyson closed the plant
On November 21, 2025, Tyson announced it would "end operations at its Lexington, Nebraska, beef facility." The release gave one reason. The changes were "designed to right size its beef business and position it for long-term success."
The release did not say why Lexington was chosen, and we found no statement from Tyson that does. Nebraska Gov. Jim Pillen said he was told that a key factor was the age of a plant first built to make farm machinery. That is the governor's account of what he was told. He also said Tyson did not ask the state for incentives to stay.
Tyson's own financial reports show a beef business that had been losing money. The chart below shows the profit or loss Tyson reported for its beef segment in each fiscal year.

The fiscal 2025 loss includes legal costs and write-offs. Without them, Tyson puts the loss at $426 million. The figures cover every Tyson beef plant, not Lexington alone. Source: Tyson Foods earnings releases filed with the SEC.
Tyson later tied the closure to the supply of cattle. On a February 2026 call with investors, an executive said the Lexington closure and a shift cut at its Amarillo, Texas, plant were "in response to the ongoing challenges of a tighter U.S. cattle supply." The chart below, from U.S. Department of Agriculture data, has the size of the U.S. cattle herd on the left and the price paid for cattle on the right.
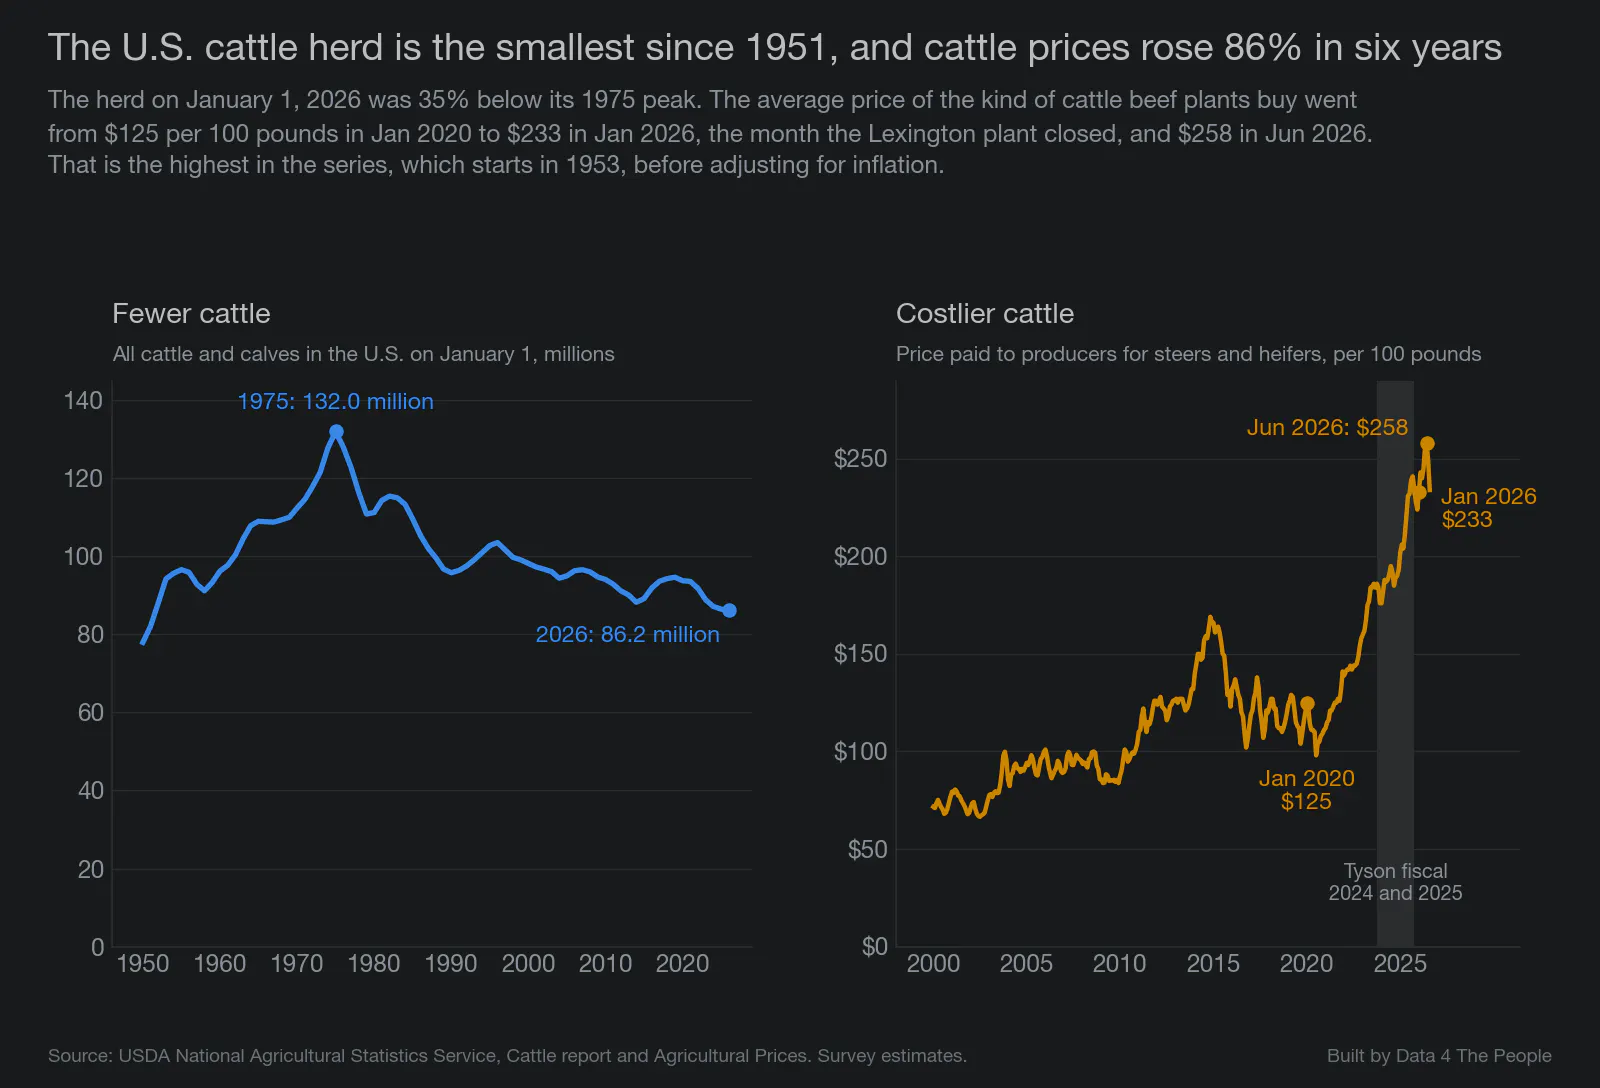
Prices are not adjusted for inflation. Source: USDA National Agricultural Statistics Service.
A beef plant buys cattle and sells beef. This chart shows only the buying side, so it does not explain Tyson's losses. It does show that the kind of cattle beef plants buy cost 86% more in January 2026, the month the plant closed, than six years earlier.
In August 2026 Tyson said it would also end operations at its beef plant in Joslin, Illinois, citing "one of the most historic cattle shortages the country has ever experienced."
What happened next
The layoff notice covered 3,212 positions, with work ending on or around January 20, 2026. Tyson kept about 290 people on to wind the plant down. The last of them left on July 24.
The chart below shows a federal count of the jobs located in Dawson County since 2014.
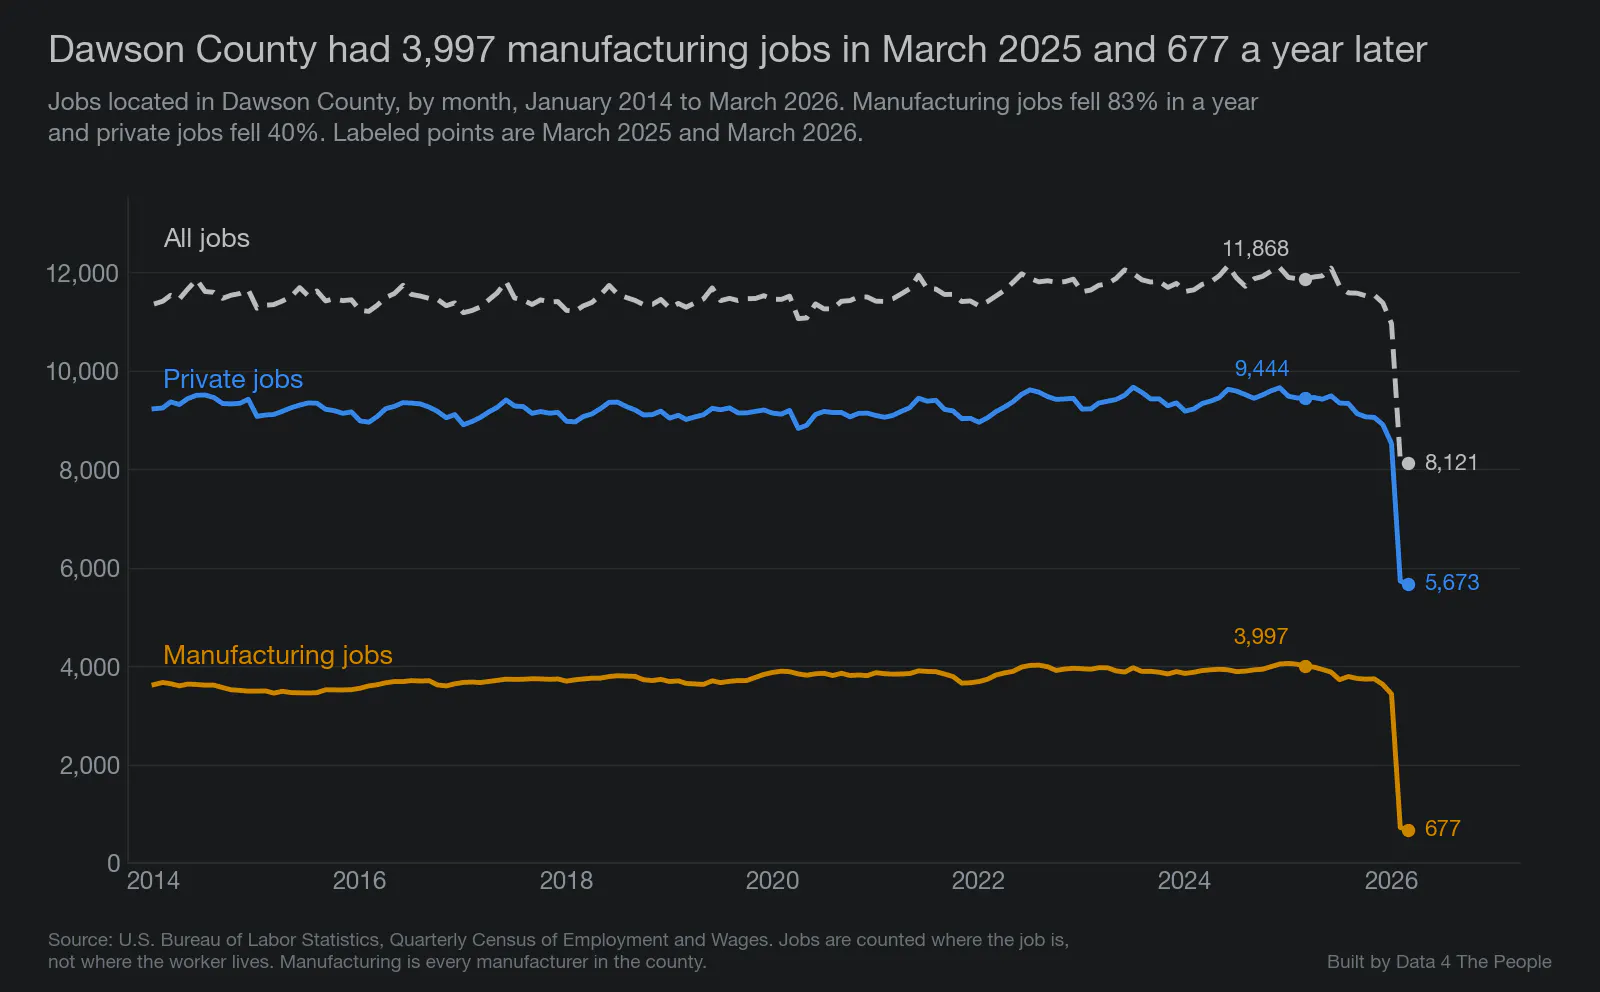
Manufacturing jobs fell 83% in a year and private jobs fell 40%. Manufacturing here is every manufacturer in the county. Source: U.S. Bureau of Labor Statistics, Quarterly Census of Employment and Wages.
The next chart shows the unemployment rate among people who live in the county, beside Nebraska's and the country's.
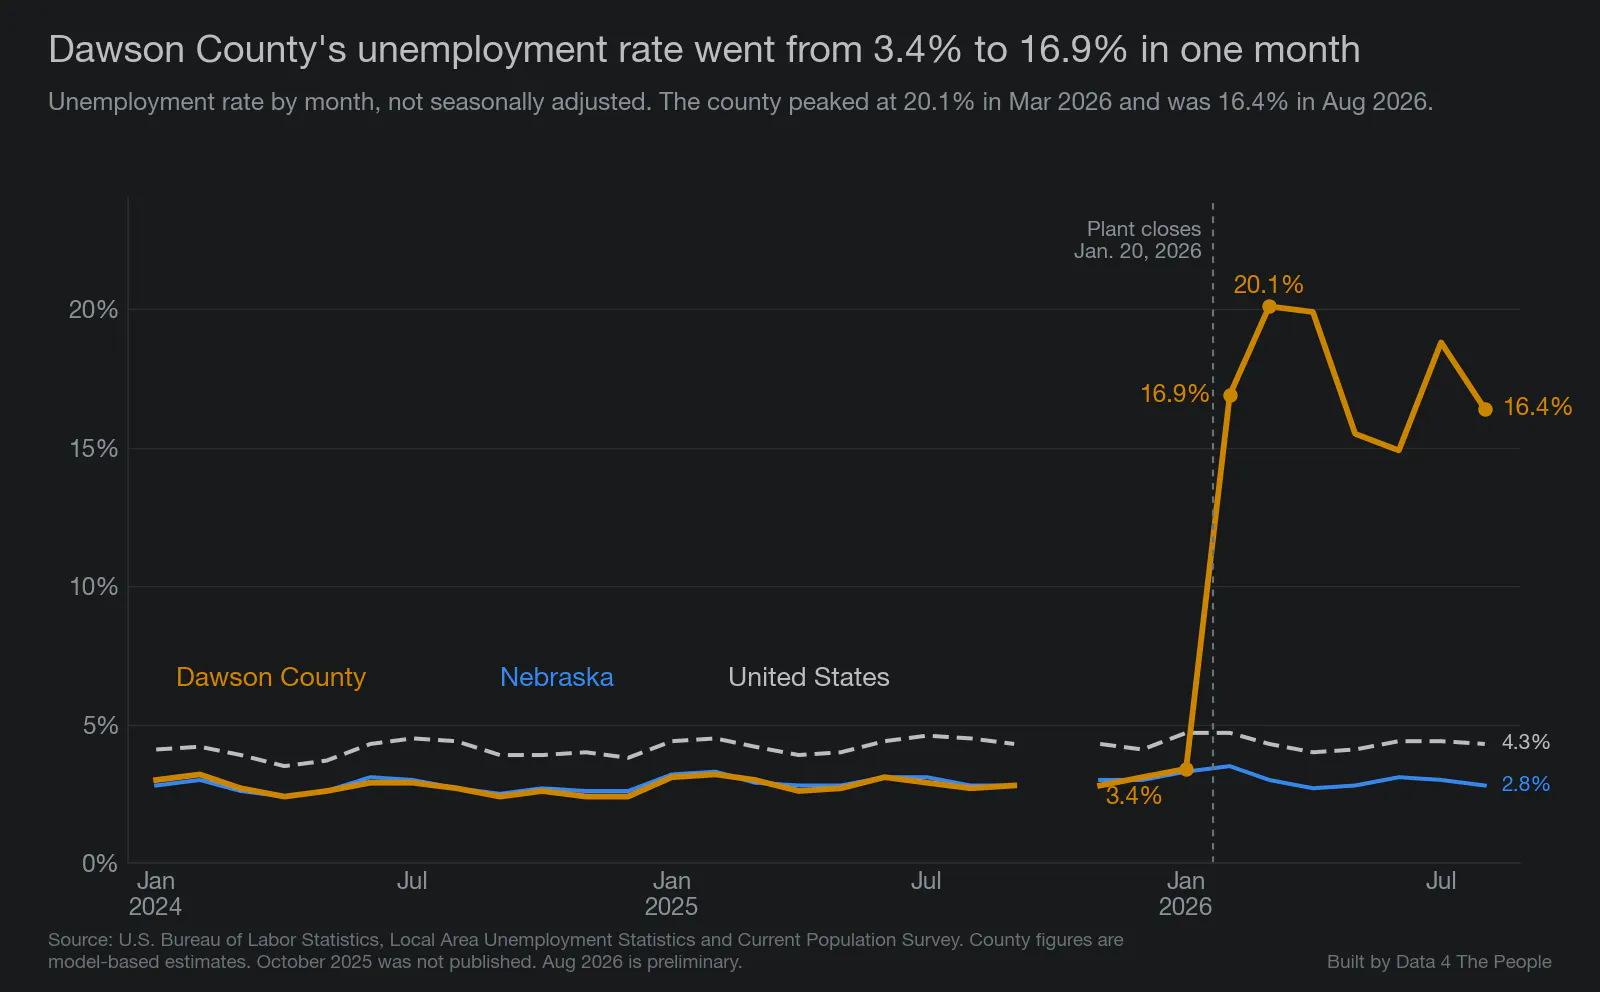
County figures are estimates from a model, not a direct count. October 2025 was not published. Source: U.S. Bureau of Labor Statistics.
The rate has come down from its peak, but someone who moves away or stops looking for work no longer counts as unemployed. The last chart shows the number of county residents with a job, and the number working or looking for work.

Estimates from a model; August 2026 is preliminary. Source: U.S. Bureau of Labor Statistics.
There are 3,351 fewer Dawson County residents with a job than a year ago. The county's labor force, the residents who are working or looking for work, fell by 1,761 people, or 13%. We have written often about labor force decline as a vital measure of a community's economic health.
Lexington's school enrollment fell from 3,172 to 2,877 this fall, a drop of 9.3%, according to Nebraska Public Media. The district had expected to lose between 150 and 750 students.
In April the city council authorized a deal to take over Tyson's wastewater plant and nearby farmland. As of October 1, the plant itself still sat empty.
How we found this story
That is the story of Dawson County.
Rather than belabor the obvious, here are two points in brief:
- This county is a case study of the reality of economic development in rural America. We can provide all the tax incentives and grants we want to employers to come to rural counties (JobsOhio – pay attention here), but if the goal is to employ more people, we must study these counties to understand if there are even enough working-age people to support a new employer.
- “Healthy” rural economic data can hide how much a county depends on one employer, especially in counties with a lot of manufacturing jobs.
Instead of hammering these two points, I want to close this with another callout to the 1997 study by Lourdes Gouveia and Donald Stull that was the basis for much of the history in the story you just read.
Without this amazing work, there is no connective tissue to this story. And I just got lucky. I had no idea this work existed. Yesterday morning, I had no clue that the Dawson County story was a story about immigration. Searches on what we knew from the Rentals Within Reach visualization – higher incomes, better rental affordability, and the Tyson meatpacking plant – did not turn up Gouveia and Stull’s research.
But our agentic AI process found it. Not only did it find it, but it also stressed that this was the linchpin in telling the Dawson County story. I read the report and just sat thinking – how much brilliant research is out there on our communities that can now be unearthed, and in this case, continued?
So, to the journalists out there who are wary of AI: sit with this question. Is AI really the enemy of journalism? Or maybe, could you be using it wrong?
What this does not tell you
- Where the workers went. No public data yet shows who left Dawson County or where they went. The first Census Bureau population estimate that could show it is due in 2027.
- Why Tyson chose Lexington. Tyson has not said. Its financial reports cover all of its beef plants together.
- Why local workers did not fill the jobs in 1990. The 1997 study measured who was hired, not who turned the work down.
- How well the 66 interviews stand for everyone. The researchers found people through a shelter, social gatherings and referrals, not at random.
- What plant workers were paid. Tyson has not published a wage figure. The closest public measure is average pay for manufacturing jobs in Dawson County, most of which were at the plant: about $54,200 a year in 2024, or about $1,040 a week, according to the U.S. Bureau of Labor Statistics. That average includes every manufacturer in the county and every kind of worker, from the line to management. The renter income in our map covers all renters in the county.
- The exact unemployment rate. County rates are built from a model and get revised each spring. After a shock this large, the revision could be big.
- Workers who lived outside the county. They are in the count of jobs lost, but not in the county's unemployment figures.
The data, code and charts behind this story are on GitHub.
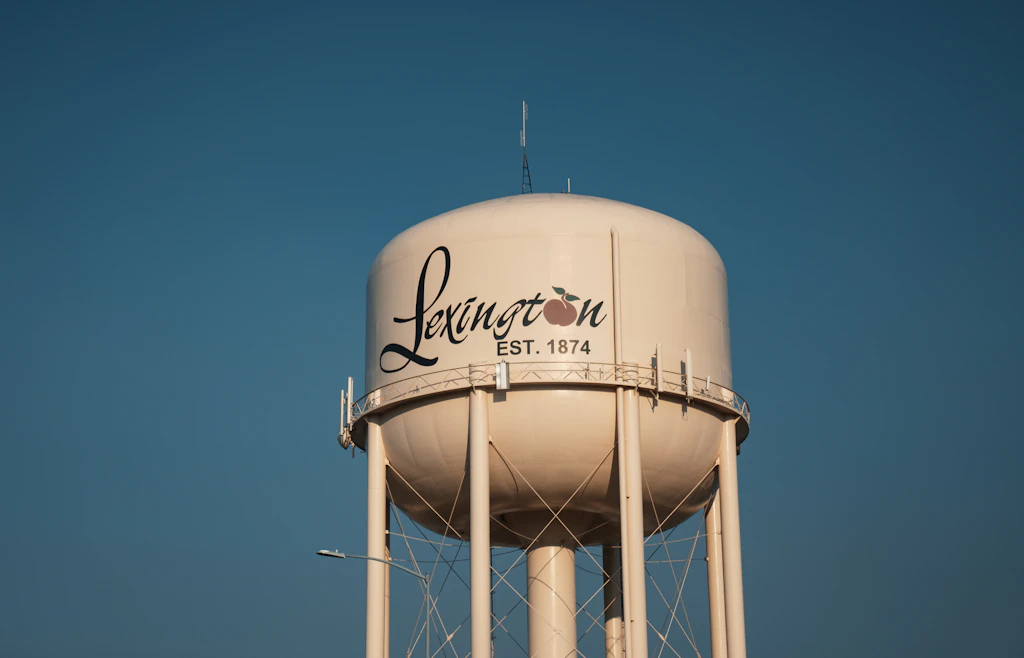
Top photo: the Lexington water tower, by [Tony Webster](https://commons.wikimedia.org/wiki/File:City_of_Lexington,_Nebraska_-_Water_Tower_(46537540401).jpg), [CC BY 2.0](https://creativecommons.org/licenses/by/2.0/).
Support Data That Serves the Public
Data should empower people, not just institutions. Your support helps us create accessible research, visualizations, and tools that uncover economic inequality and inform better decisions.
Donate
Enjoying this post?
Tell others about it.
More articles like this
Fetching Related Posts
There are no other articles tagged with Research