
September 2026 update: 35% of counties in structural labor force loss
1,132 U.S. counties were in structural loss in September, a net increase of 40 among counties with data in both years. Half the increase is in Michigan, and we are checking those numbers.

Eric Pachman
Published
November 4th 2026
The national picture
The Bureau of Labor Statistics (BLS) posted county labor force data through September 2026 on October 28, 2026. In September, 1,132 of 3,214 U.S. counties and Puerto Rico municipios were in structural labor force loss. That means their labor force was more than 10% below the same month 20 years earlier. It works out to 35.2% of all counties. The map below, from our free interactive labor force map, shows every county's 20-year change, month by month, through September 2026.
Looking at the 3,207 counties with data in both years, the number of counties in structural loss rose by 40 from September 2025. In all, 129 counties entered the structural loss group while 89 left it.
The chart below shows the share of counties in structural loss for every September since 2012. September 2026 is the third highest, behind two post-COVID years: 2022 (36.2%) and 2021 (35.5%).
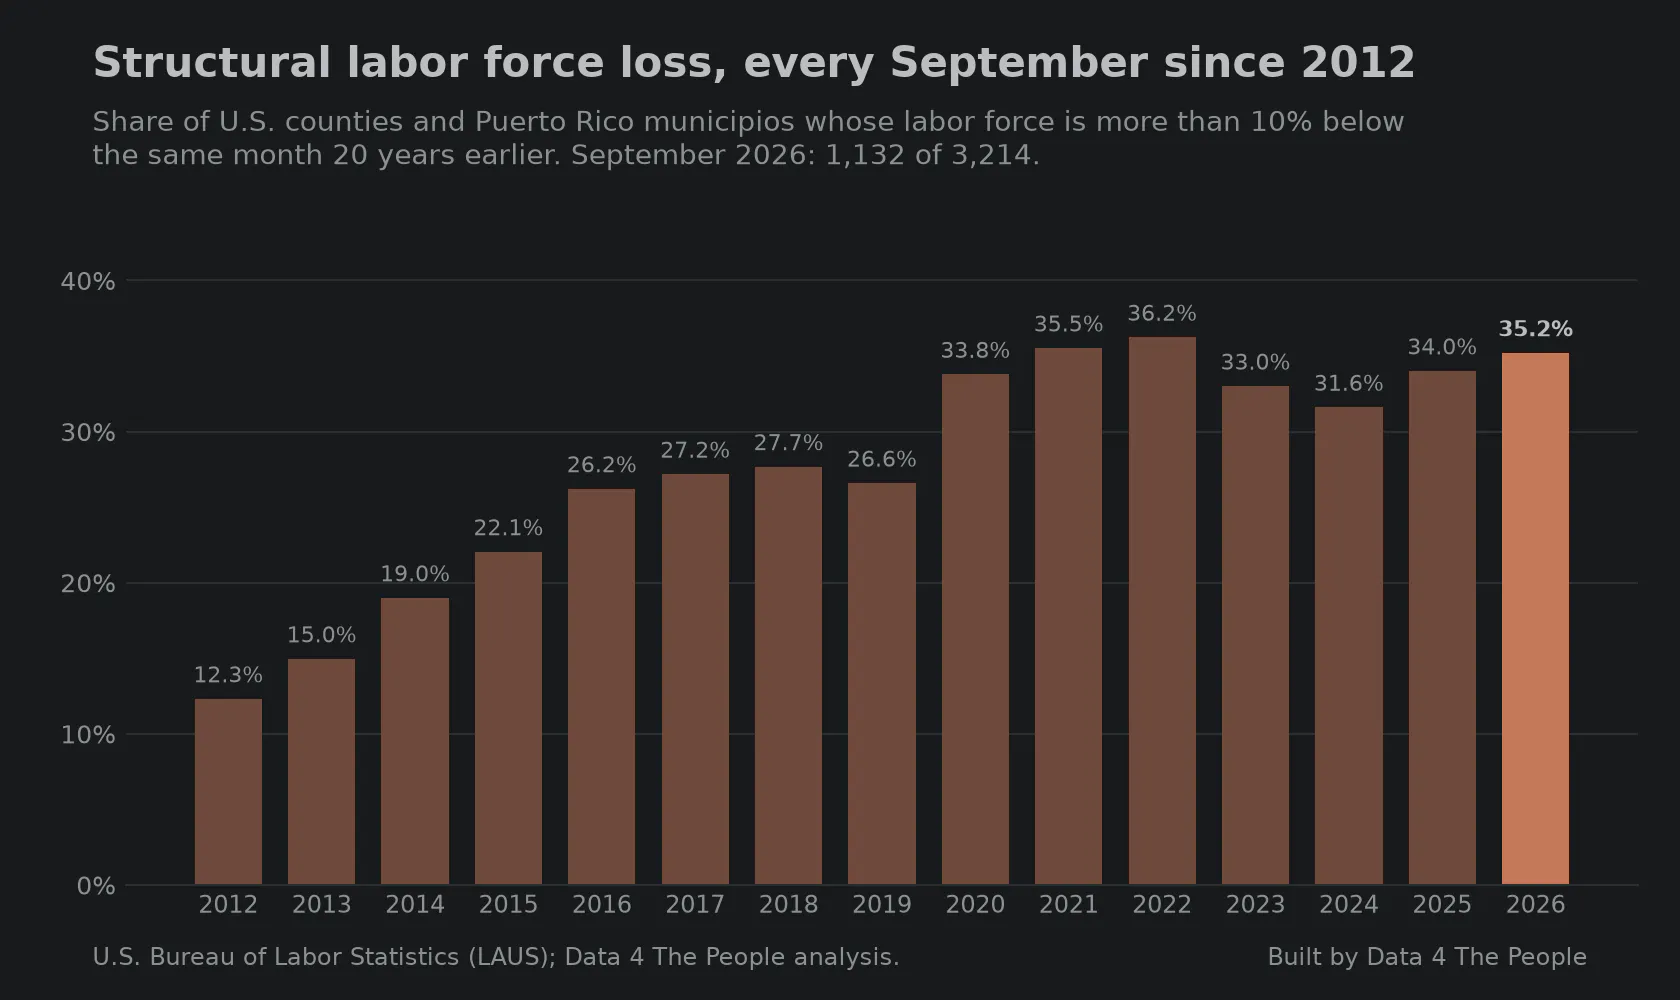
Structural labor force loss, every September since 2012. Source: U.S. Bureau of Labor Statistics (LAUS); Data 4 The People analysis.
The other five bands
In September 2026, 374 counties (11.6%) had a labor force at least 20% larger than 20 years earlier, the Superstars and Hyper-Growth bands together. That is the lowest share of any September since 2012, when it was 983 counties (30.6%).
At the other end, 60.3% of counties had a smaller labor force than 20 years earlier, counting structural loss and at-risk contraction together. That is close to 2021 and 2022 (61.0% in both) and up from just 30.4% in 2012.
The chart below shows the share of counties in each band for every September since 2012.
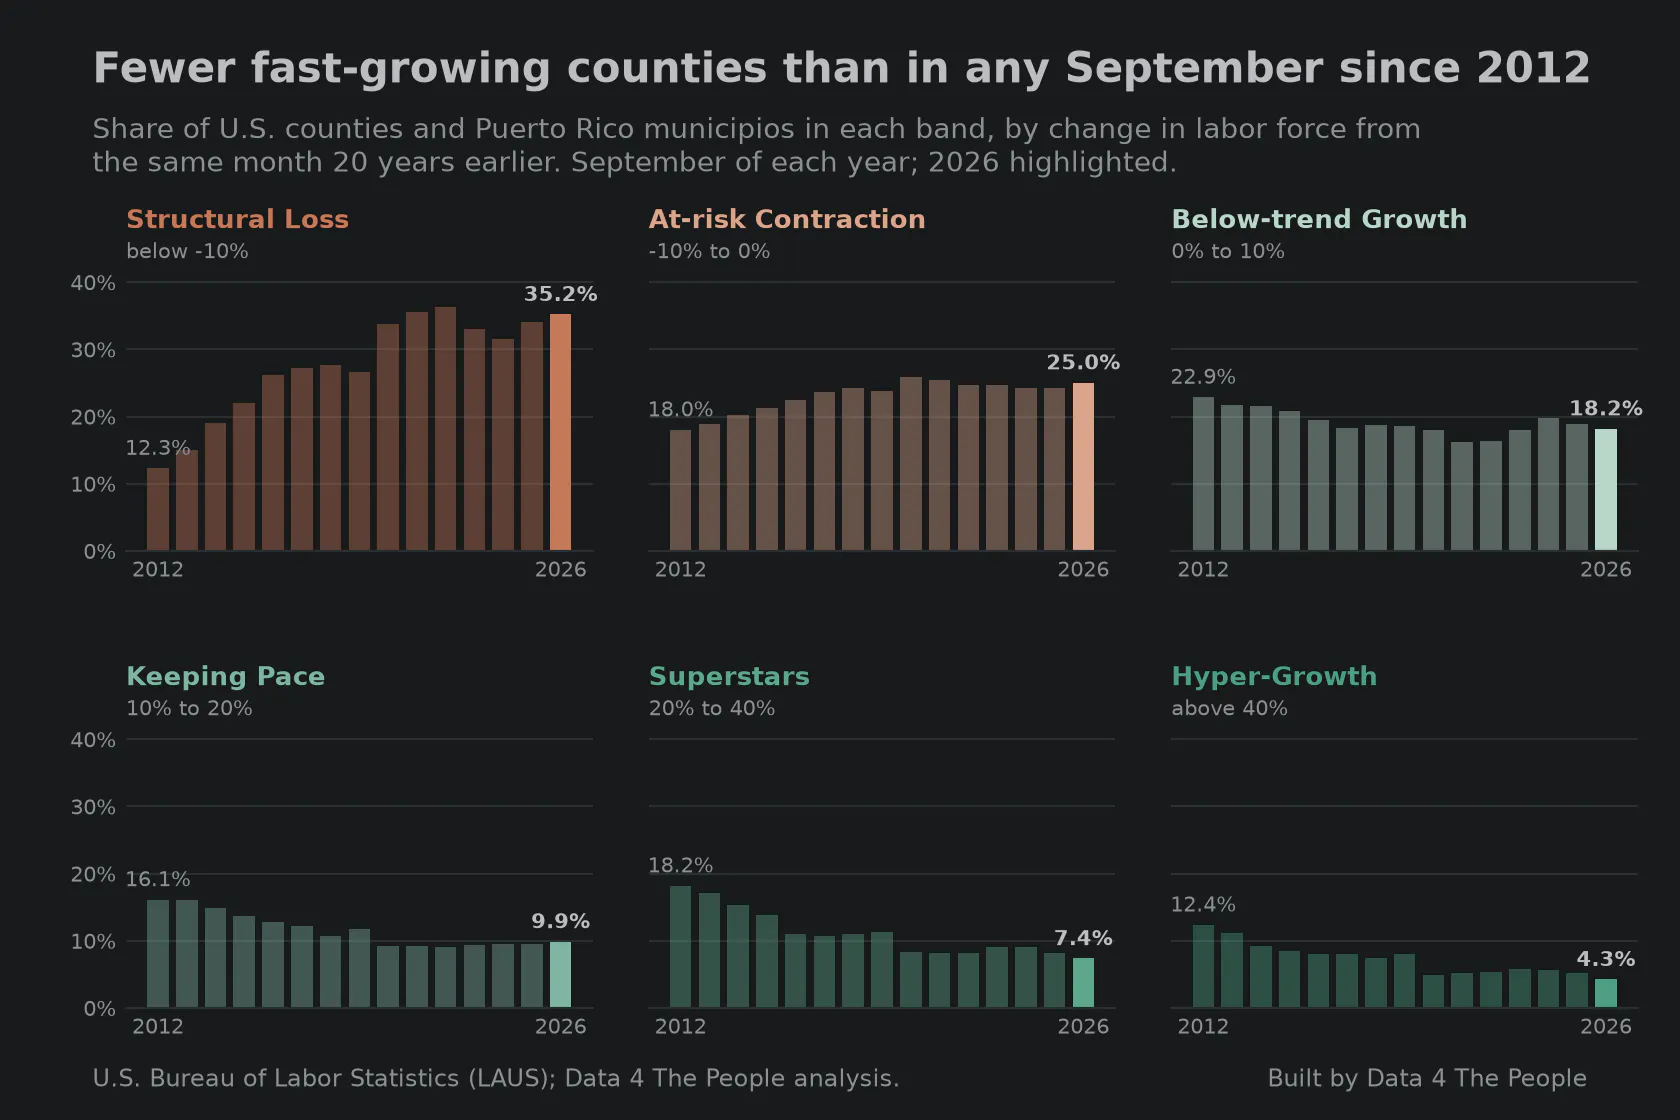
Fewer fast-growing counties than in any September since 2012. Source: U.S. Bureau of Labor Statistics (LAUS); Data 4 The People analysis.
But can we trust the latest data?
One state accounts for half of the net increase of 40 counties. In Michigan, 20 counties entered structural loss in the past year and none left. The next largest net gains were in Minnesota (10), Oklahoma (9) and Tennessee (9).
Initially, the rest of this post was about Michigan and its rapid labor force decline in 2026. But as we worked through our validation steps of the data, something concerning arose. Michigan's labor data in this BLS database disagrees with Michigan's data in another BLS labor database. Now, the two databases are different. They are based on surveys of different people. The data in our labor force visualization comes mainly from a survey of American households. The other data comes from a survey of businesses. If we asked the first group of Michiganders, "how many of you are employed," and the second group, "how many employed people do you have," the answers should be at least similar, right? They are not. The employer data says jobs are flat in Michigan. The population data says that employed residents are down an astounding 4.5% since January 2025. The chart below shows both Michigan measures since January 2024.
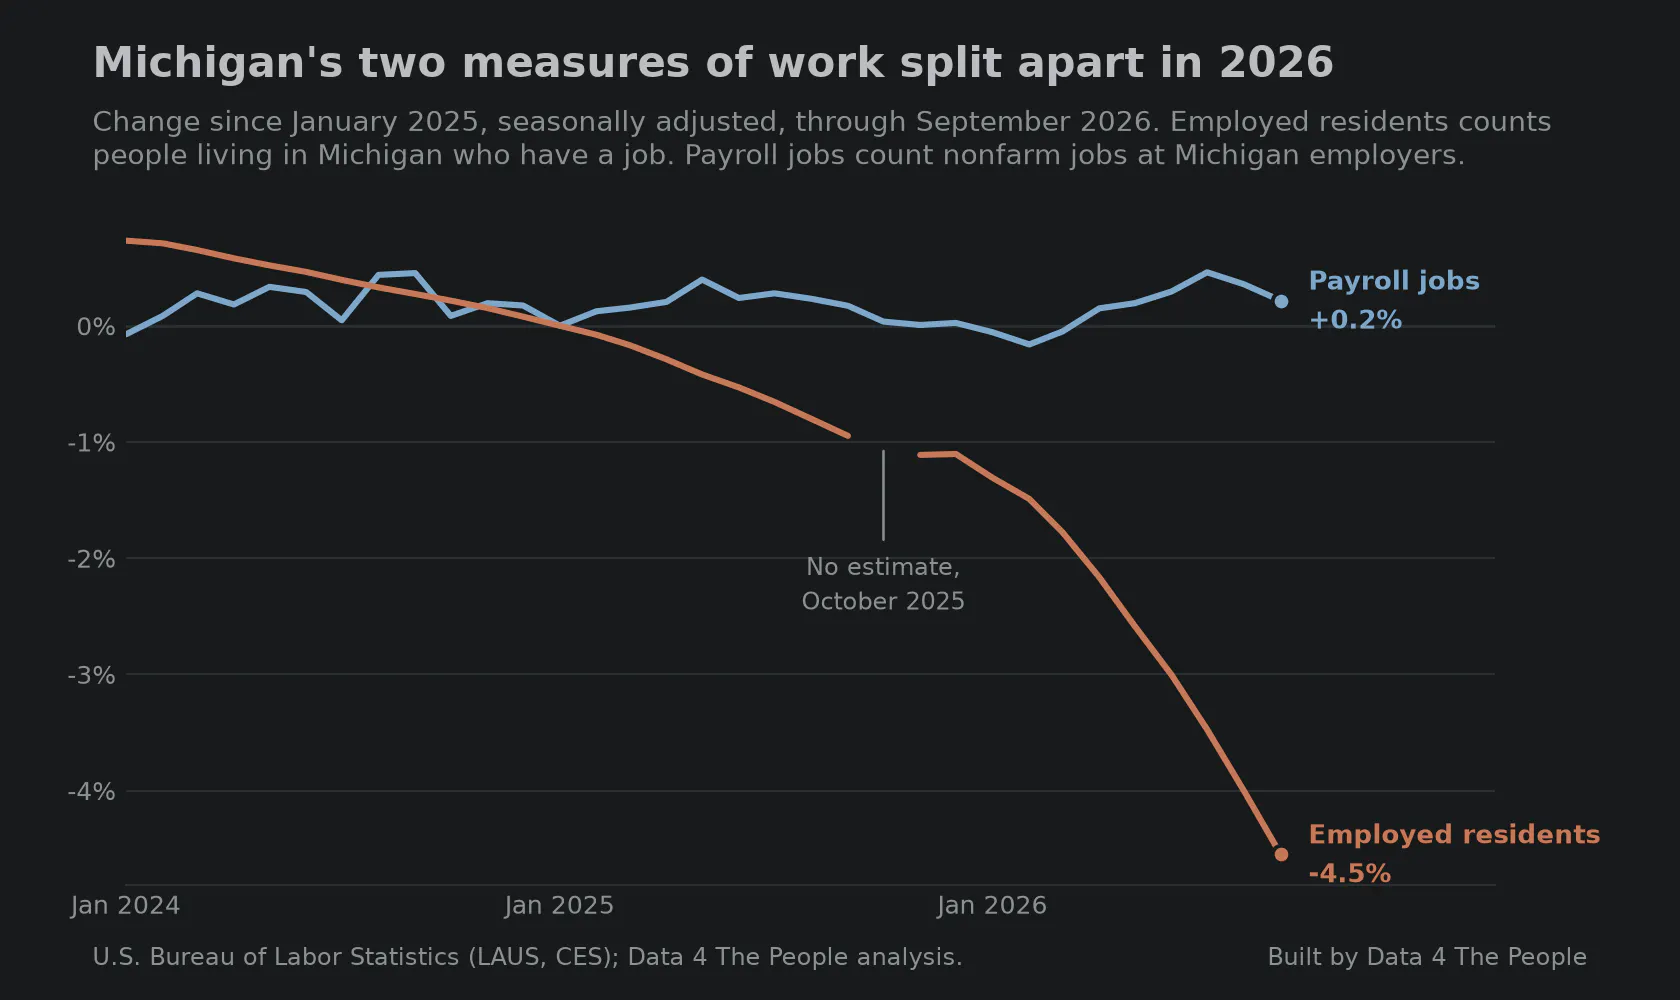
Michigan's two measures of work split apart in 2026. Source: U.S. Bureau of Labor Statistics (LAUS, CES); Data 4 The People analysis.
So, we went looking through other states' data. The chart below shows the problem. It takes a minute to sink in, but it's worth the effort. For each state, we compare two numbers: how much the count of employed residents (based on the household survey) changed from a year earlier, and how much the count of jobs (as reported by employers) changed. If those two numbers are within 2 percentage points of each other, the state is not counted.
Each pair of bars is one month. A bar below the line counts the states where employed residents trailed jobs by 2 points or more, like Michigan. A bar above the line counts the states where employed residents ran ahead of jobs by 2 points or more. When the two measures roughly agree, as they did in most months from 2015 to 2019, the bars stay short. A tall bar means many states got very different answers from the two measures in the same month.
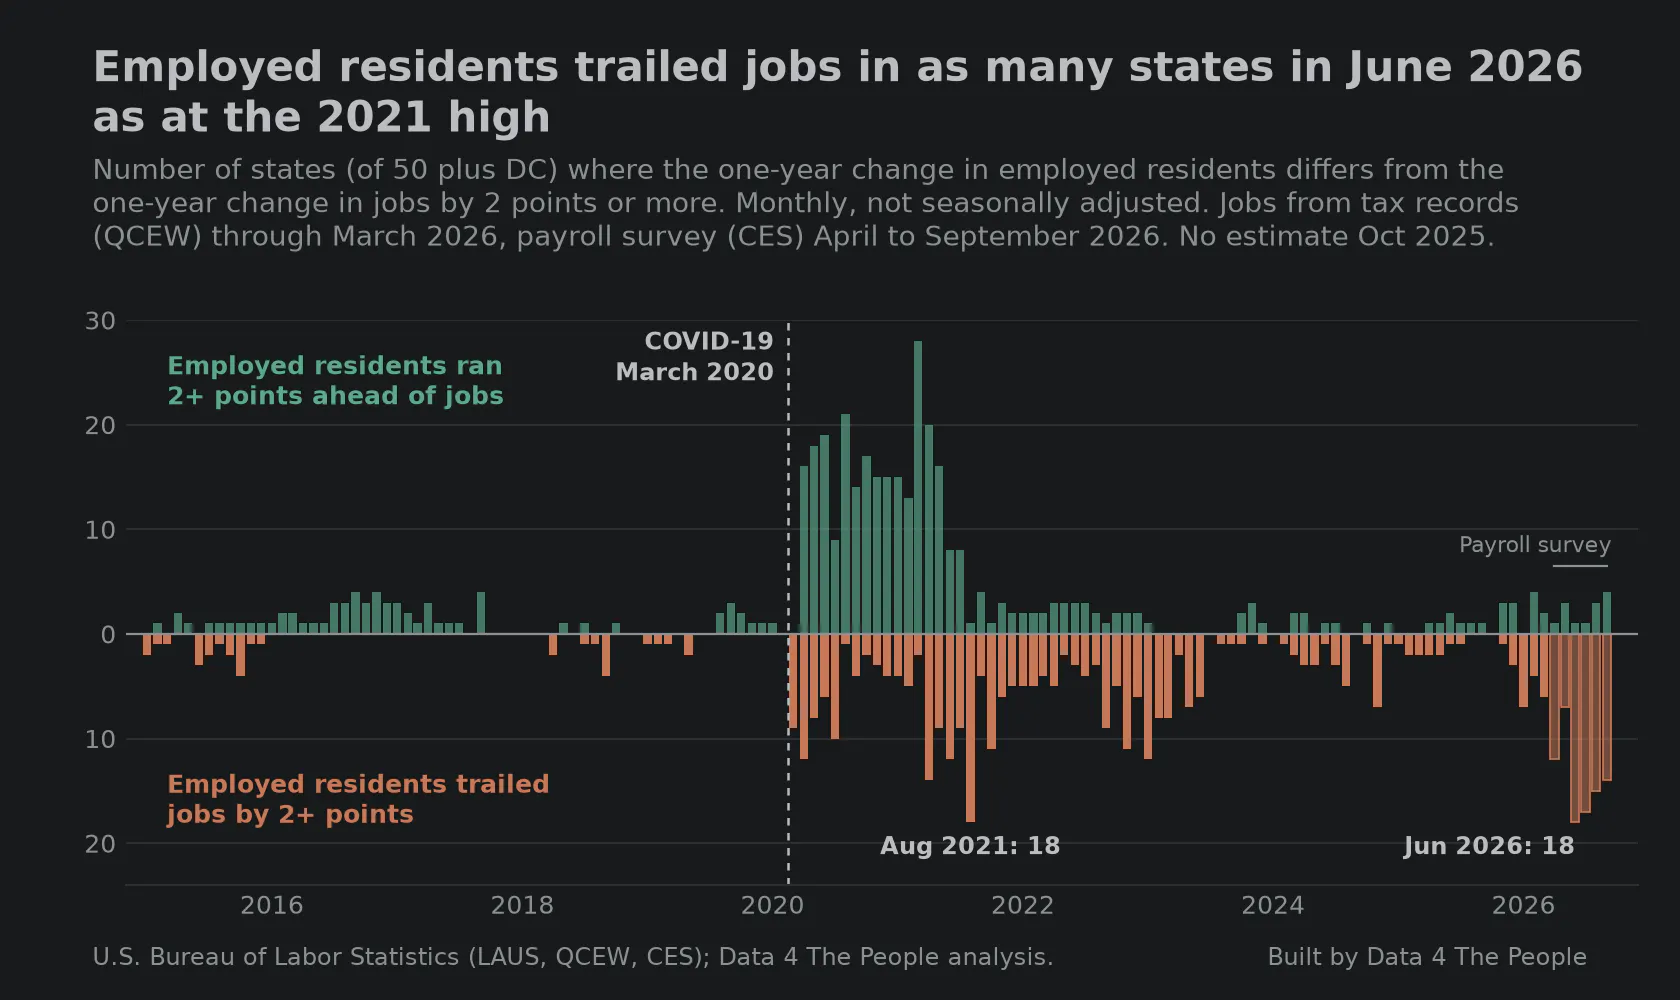
Employed residents trailed jobs in as many states in June 2026 as at the 2021 high. Source: U.S. Bureau of Labor Statistics (LAUS, QCEW, CES); Data 4 The People analysis.
Clearly, in 2020, COVID was a shock to our labor force and to the surveys that measure it. Models that hadn't really been stressed in the past were stressed, and BLS tried to make changes in real time. It reminds me of a shock to a refinery and the control room operator trying to monkey with the valves to get the system back to homeostasis. But if you move the valves too much, you risk making the problem worse. Something like that may be happening now. The result is that the two primary measures of our workforce are spitting out conflicting signals for some states. One says Michigan is losing employed residents at an alarming clip. The count of jobs says nothing is changing. Not knowing which one is correct may be even scarier than knowing.
We will be coming back to this wonky but immensely important topic in the coming weeks and months. Our goal here at Data 4 The People is to bring public data to you in a form that can bring insight, spur discussion, and lead to positive change. But we have to go into working with public data with a skeptical eye, especially as government agencies rely on models stretched thin to gross up surveys with worsening response rates. We'll do our best to uncover discrepancies between datasets to help you understand what to trust, and what to hold lightly.
What this does not tell you
- County labor force figures are model estimates, not direct counts. BLS controls them to a state or area total, so a small county's number is partly a share of a larger estimate.
- The 2026 figures are preliminary and are expected to change in the early-2027 revision.
- Employed residents and job counts measure different things: people where they live versus jobs where they are. They are not expected to match exactly. Job counts from employer tax records (QCEW) are about six months behind, so April to September 2026 uses the payroll survey, which is itself a sample survey and will be checked against QCEW when those counts come out.
- Seven New Orleans-area parishes have no 20-year comparison for September 2025 because their September 2005 data are missing after Hurricane Katrina. That is why the year-over-year comparison uses 3,207 counties.
- We do not yet know what is causing the gap between the surveys and the job counts. The refinery comparison is a possibility, not a finding.
How we built this
Each county is compared with its own labor force in the same month 20 years earlier, using BLS Local Area Unemployment Statistics (not seasonally adjusted). A county is in structural loss when that change is below -10.0%. Comparisons over time always use the same month. For the survey check, we compare each state's one-year change in employed residents (Local Area Unemployment Statistics) with its one-year change in jobs, month by month, not seasonally adjusted: jobs from the BLS Quarterly Census of Employment and Wages through March 2026, and from the BLS Current Employment Statistics payroll survey after that. Code and method notes are in our GitHub repository. For a guide to reading the map, see Five takeaways from our new labor force map.
Support Data That Serves the Public
Data should empower people, not just institutions. Your support helps us create accessible research, visualizations, and tools that uncover economic inequality and inform better decisions.
Donate
Enjoying this post?
Tell others about it.
More articles like this
Fetching Related Posts
There are no other articles tagged with Data 4 Thought