
How do the government’s grocery prices stack up against the real ones?
We priced the USDA’s Thrifty basket at 321 Kroger stores and compared it with CPI. I expected CPI to come up short. It didn’t.

Eric Pachman
Published
September 22nd 2026
I haven’t hidden my feelings about our nation’s most famous inflation measure, the Consumer Price Index (“CPI”). If you’ve read my work, you know I don’t like it. That’s not because it’s flat-out wrong. It measures “something.” It’s because it is not designed to capture the inflation that the typical American feels.
However, CPI is still used as if it were typical American inflation. The government uses CPI to set Social Security raises, tax brackets and SNAP benefits. It even uses CPI to police drug prices. When a drugmaker raises a drug’s price faster than CPI, it owes Medicaid a rebate for the difference, and since 2022 it owes Medicare one too. This is the source of my beef with CPI. It’s not CPI itself, but how it is misused and misinterpreted, and how policymakers use it to tell people who are struggling to make ends meet that their experience is not valid because the government’s number says so.
Today I want to focus on one piece of CPI: groceries. I designed today’s research project to test how well the individual CPI grocery components track real grocery prices. Again, you know my bias going into this work. I wanted to find that CPI was understating true grocery inflation so I could point a finger at the Bureau of Labor Statistics (BLS), which publishes it.
But this is the beauty of data work. You can have bias. In fact, it’s critical to have bias, because bias is where the passion comes from to do this crazy work rather than stream something on YouTube. But when the data says you are wrong, you have to own up to it. Have your biases and let them fuel your passion, but hold them lightly and admit when you are wrong.
That’s what I am doing right now.
I was wrong! The CPI-priced basket costs more than the real one.
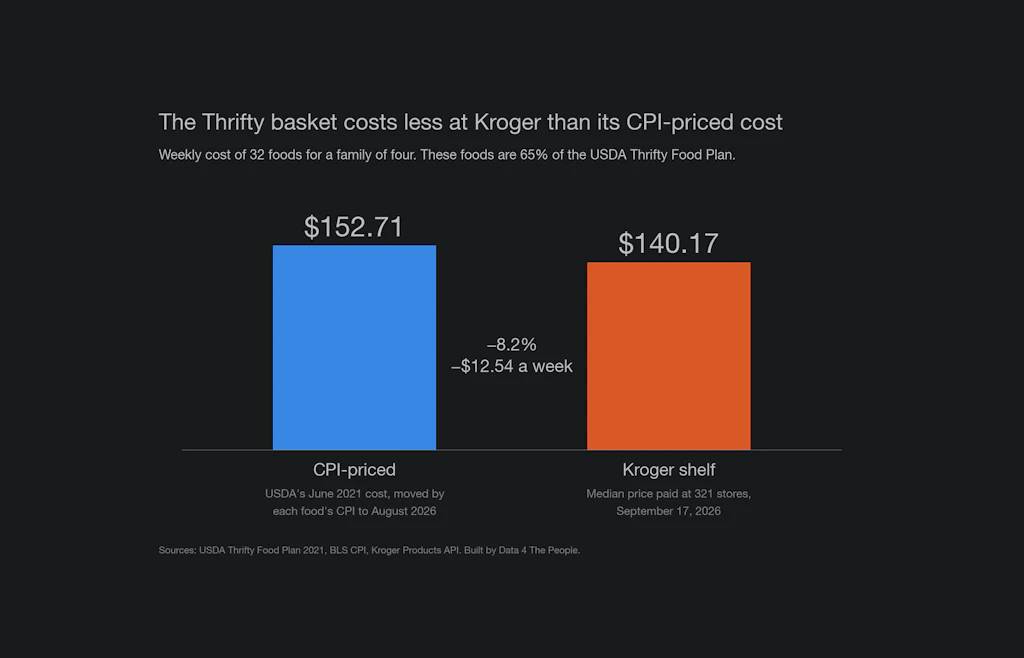
Here is the finding first. The chart below shows the weekly cost of 32 foods that make up 65% of the Thrifty basket’s cost, priced two ways.
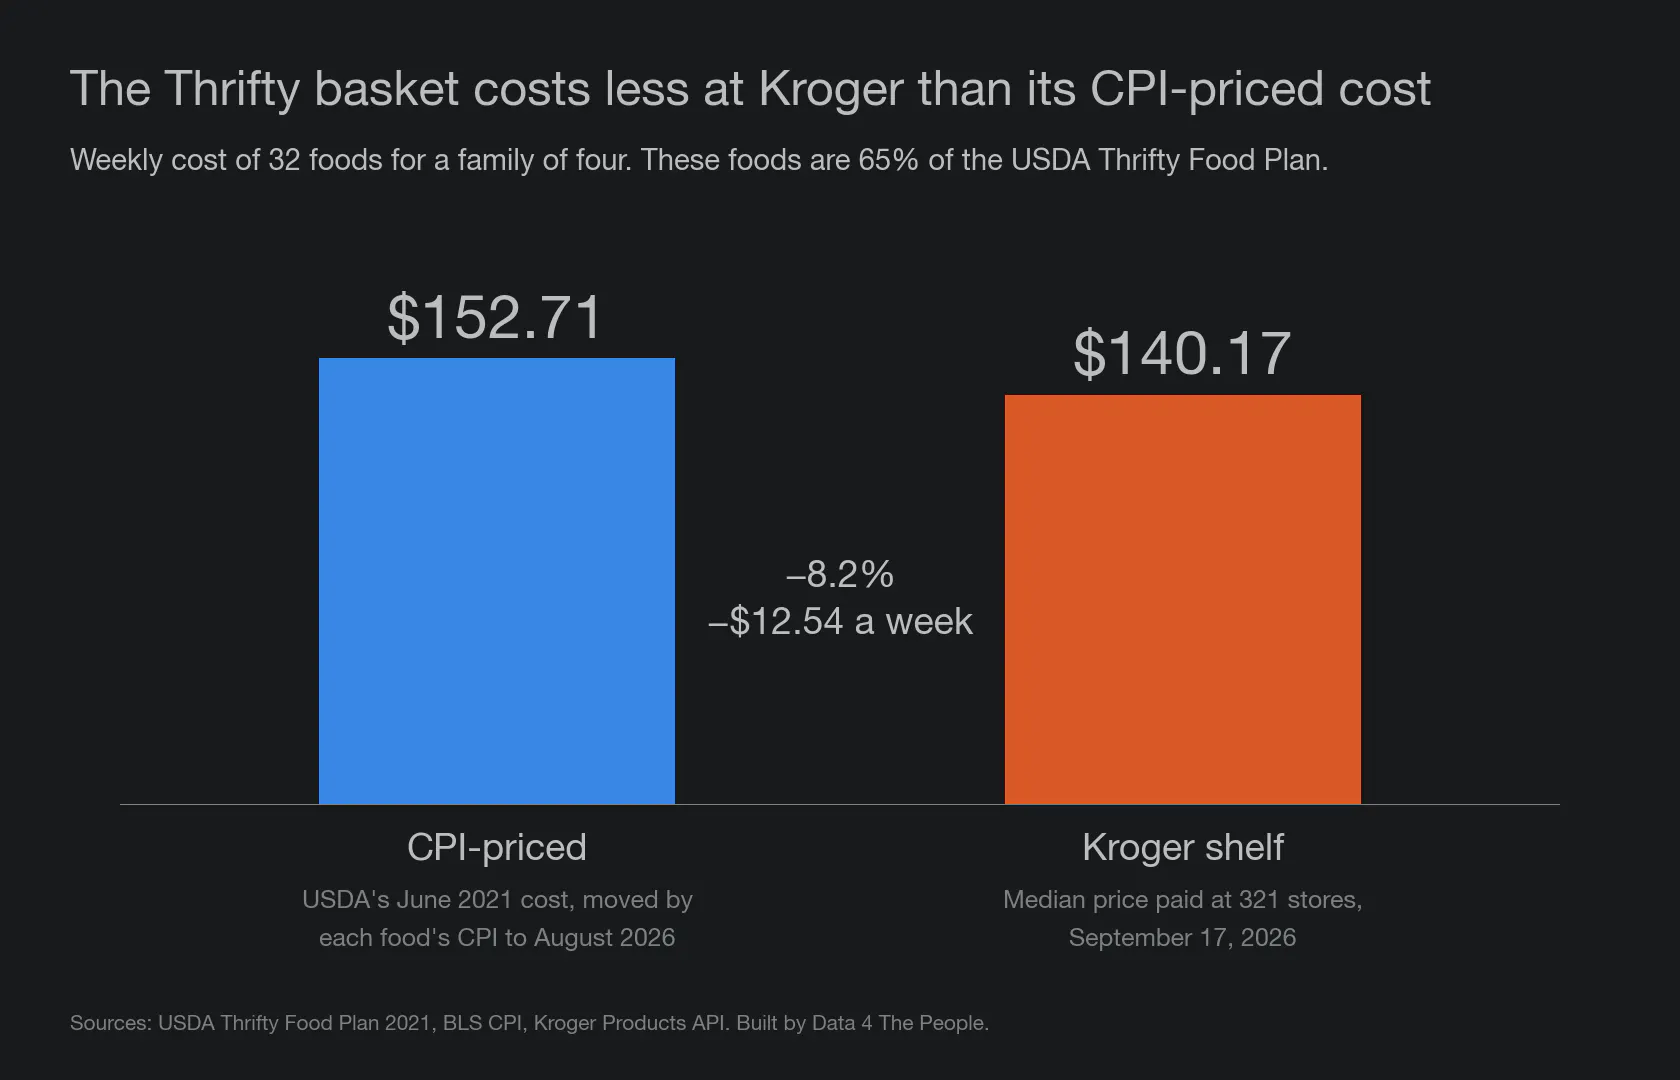
The Thrifty basket costs less at Kroger than its CPI-priced cost.
The CPI-priced basket comes to $152.71 a week. The same foods at Kroger come to $140.17. That is 8.2% less, or $12.54 a week. These are prices from one day in September 2026, so this is a snapshot, not a trend.
Here is what we did. The Thrifty Food Plan from the U.S. Department of Agriculture (USDA) is more than a dollar figure. It is a full shopping list. It gives the pounds per week of every food a family of four would buy, and what each food cost in June 2021. The USDA keeps the plan current by moving those 2021 costs up with CPI. Its latest figure, for July 2026, is $1,025 a month for a family of four.
We took the 32 most expensive foods on that list. Together they make up about two-thirds of the plan’s weekly cost. Then we priced them two ways.
The first way is the government’s way. We took each food’s June 2021 cost and moved it up by the CPI item for that food, through August 2026. Eggs move with the egg index, apples with the apple index, and so on. We call this the CPI-priced basket.
The second way is the shelf. Kroger runs a public API, which is a data feed that outside developers can pull from. Ask it for a product and a store, and it returns today’s price. So we picked up to three products for each food, usually the Kroger brand, a leading national brand and one more. That came to 83 products. Then we pulled the price of every one of them at 321 Kroger-family stores on September 17, 2026, each in a different metro or small-town area. That covers 18 store names, including Kroger, Ralphs, Fred Meyer, King Soopers and Fry’s. We turned every price into a price per pound, took the middle price across all stores, and multiplied by the USDA’s pounds per week. We used the price a shopper pays, which means the sale price when one is posted.
The table below shows both versions of the basket, food by food.
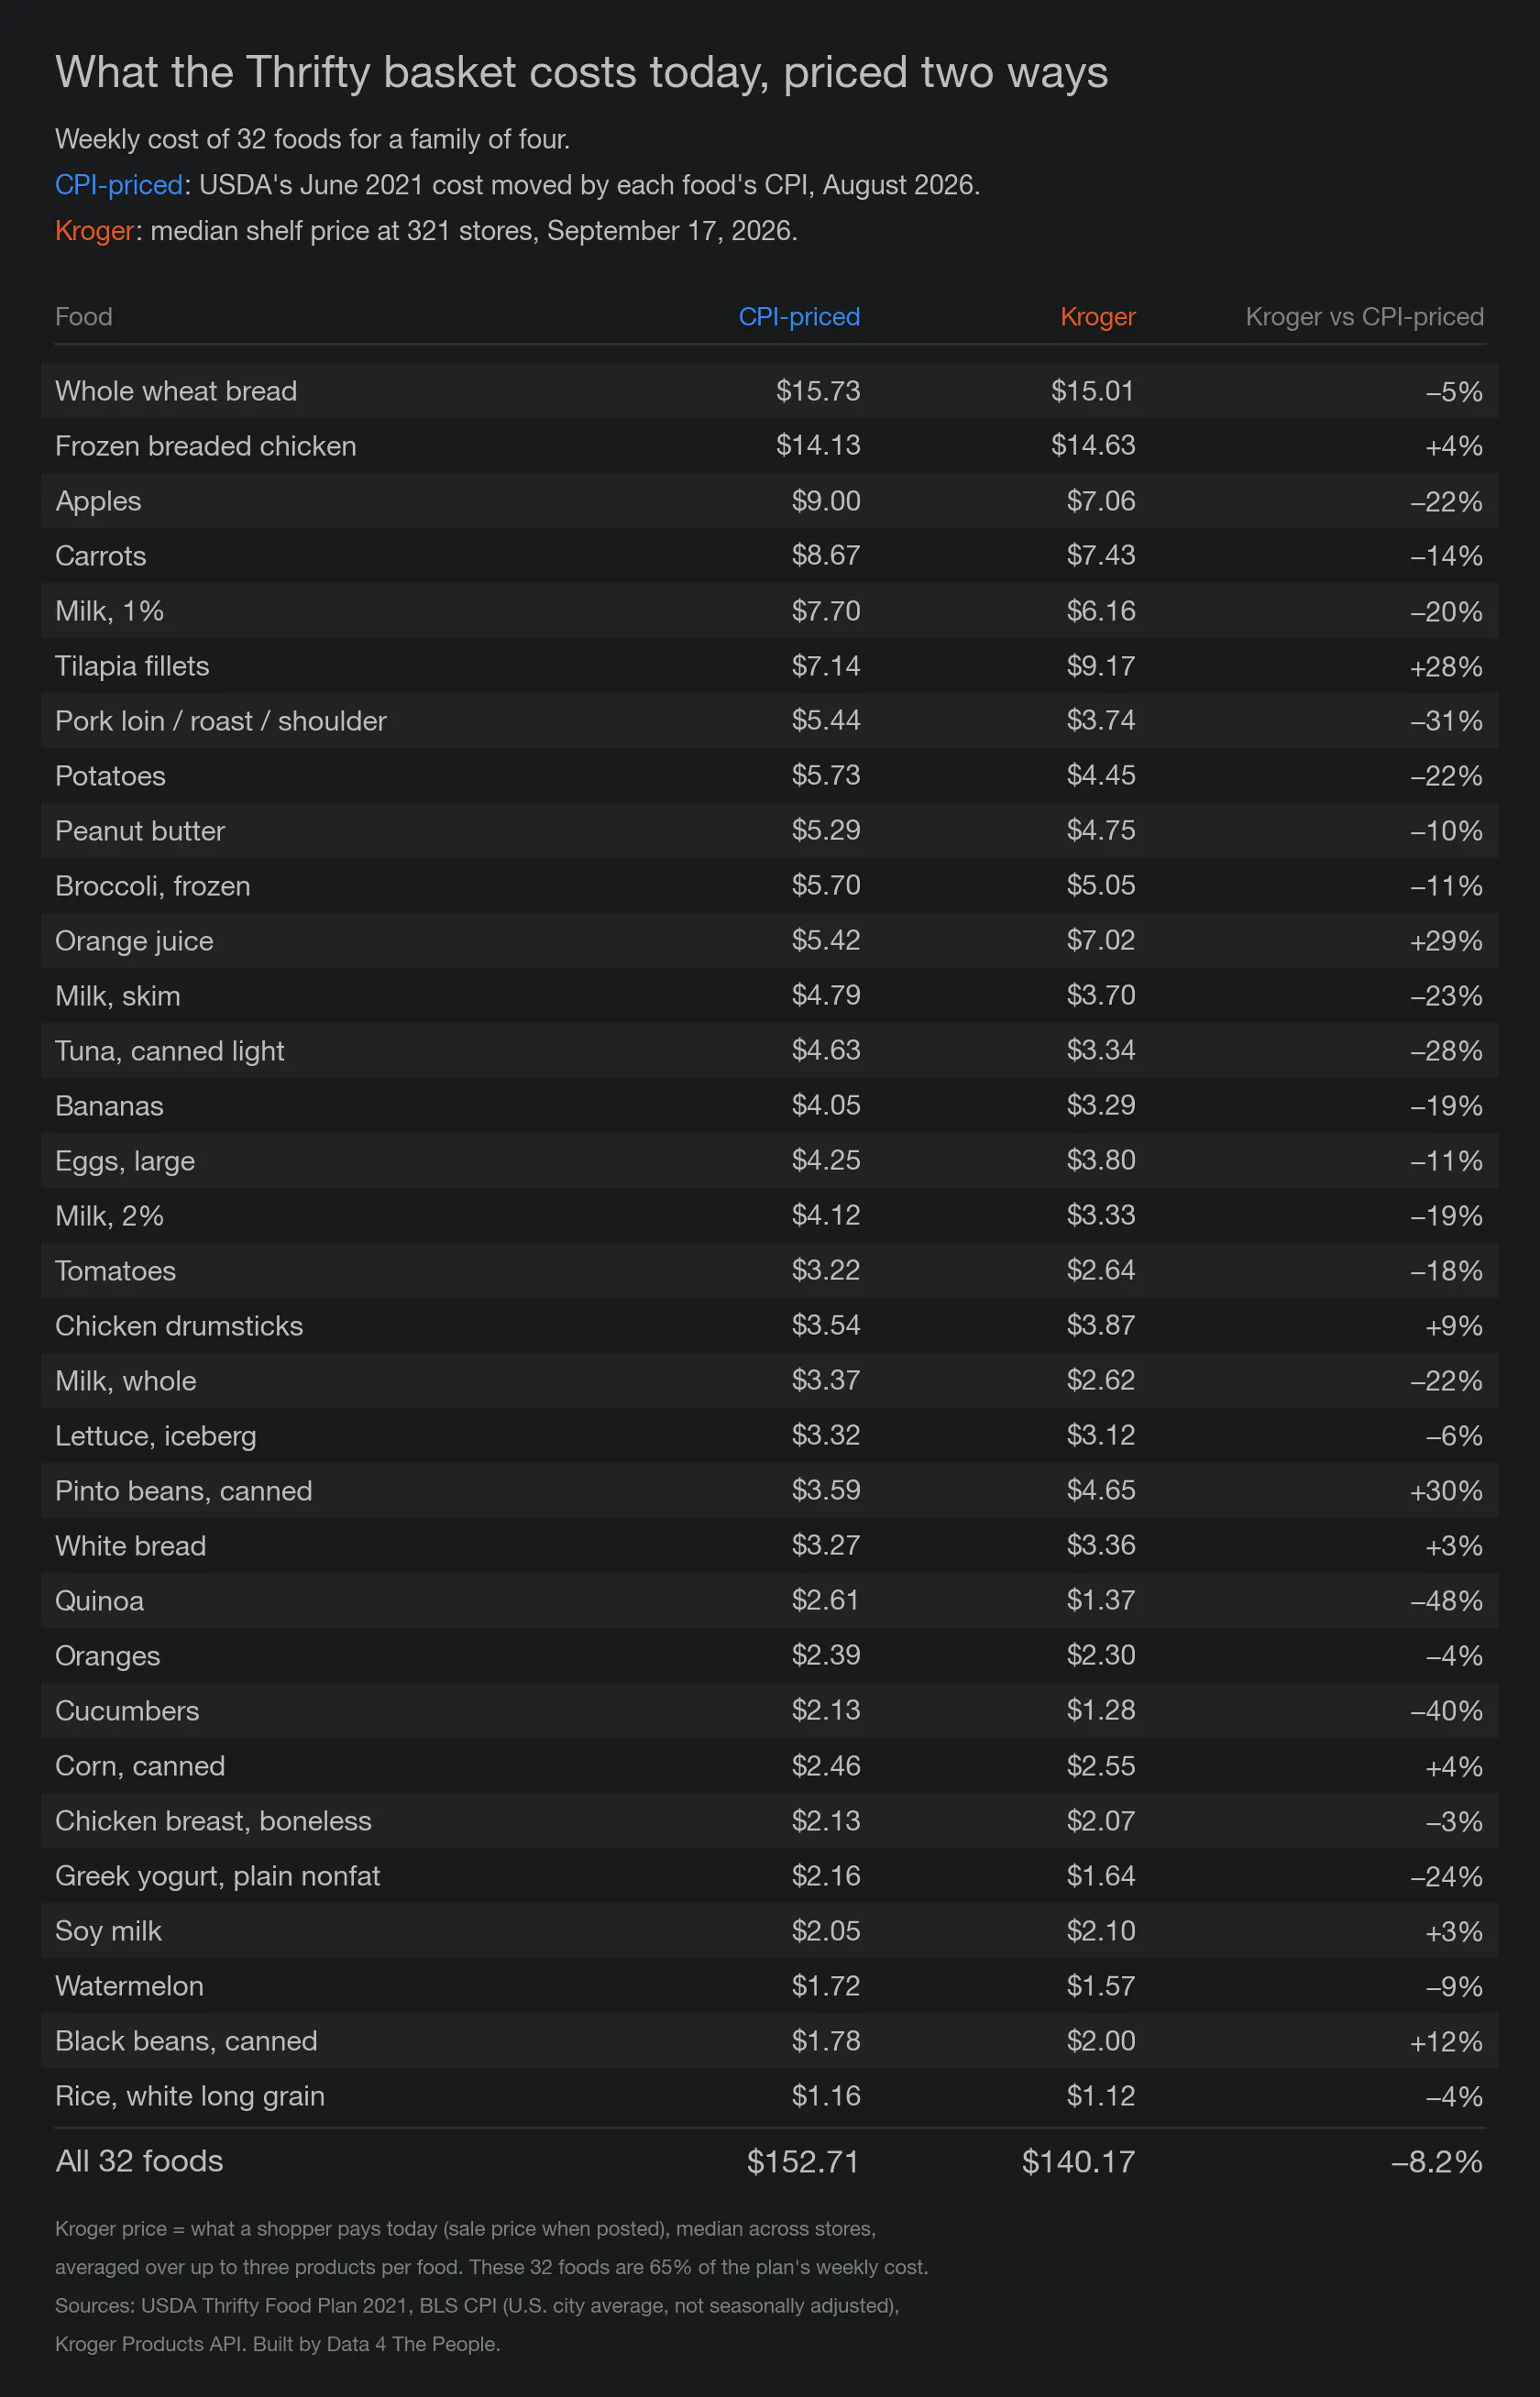
What the Thrifty basket costs today, priced two ways. CPI-priced through August 2026. Kroger prices from 321 stores on September 17, 2026.
The totals at the bottom match the chart above. If you ignore every sale and use only regular prices, Kroger comes to $144.34 a week, which is still 5.5% less than the CPI-priced basket.
The gap is not the same for every food. The next chart shows Kroger’s cost for each food compared with its CPI-priced cost. The five closest foods and the five furthest are called out.
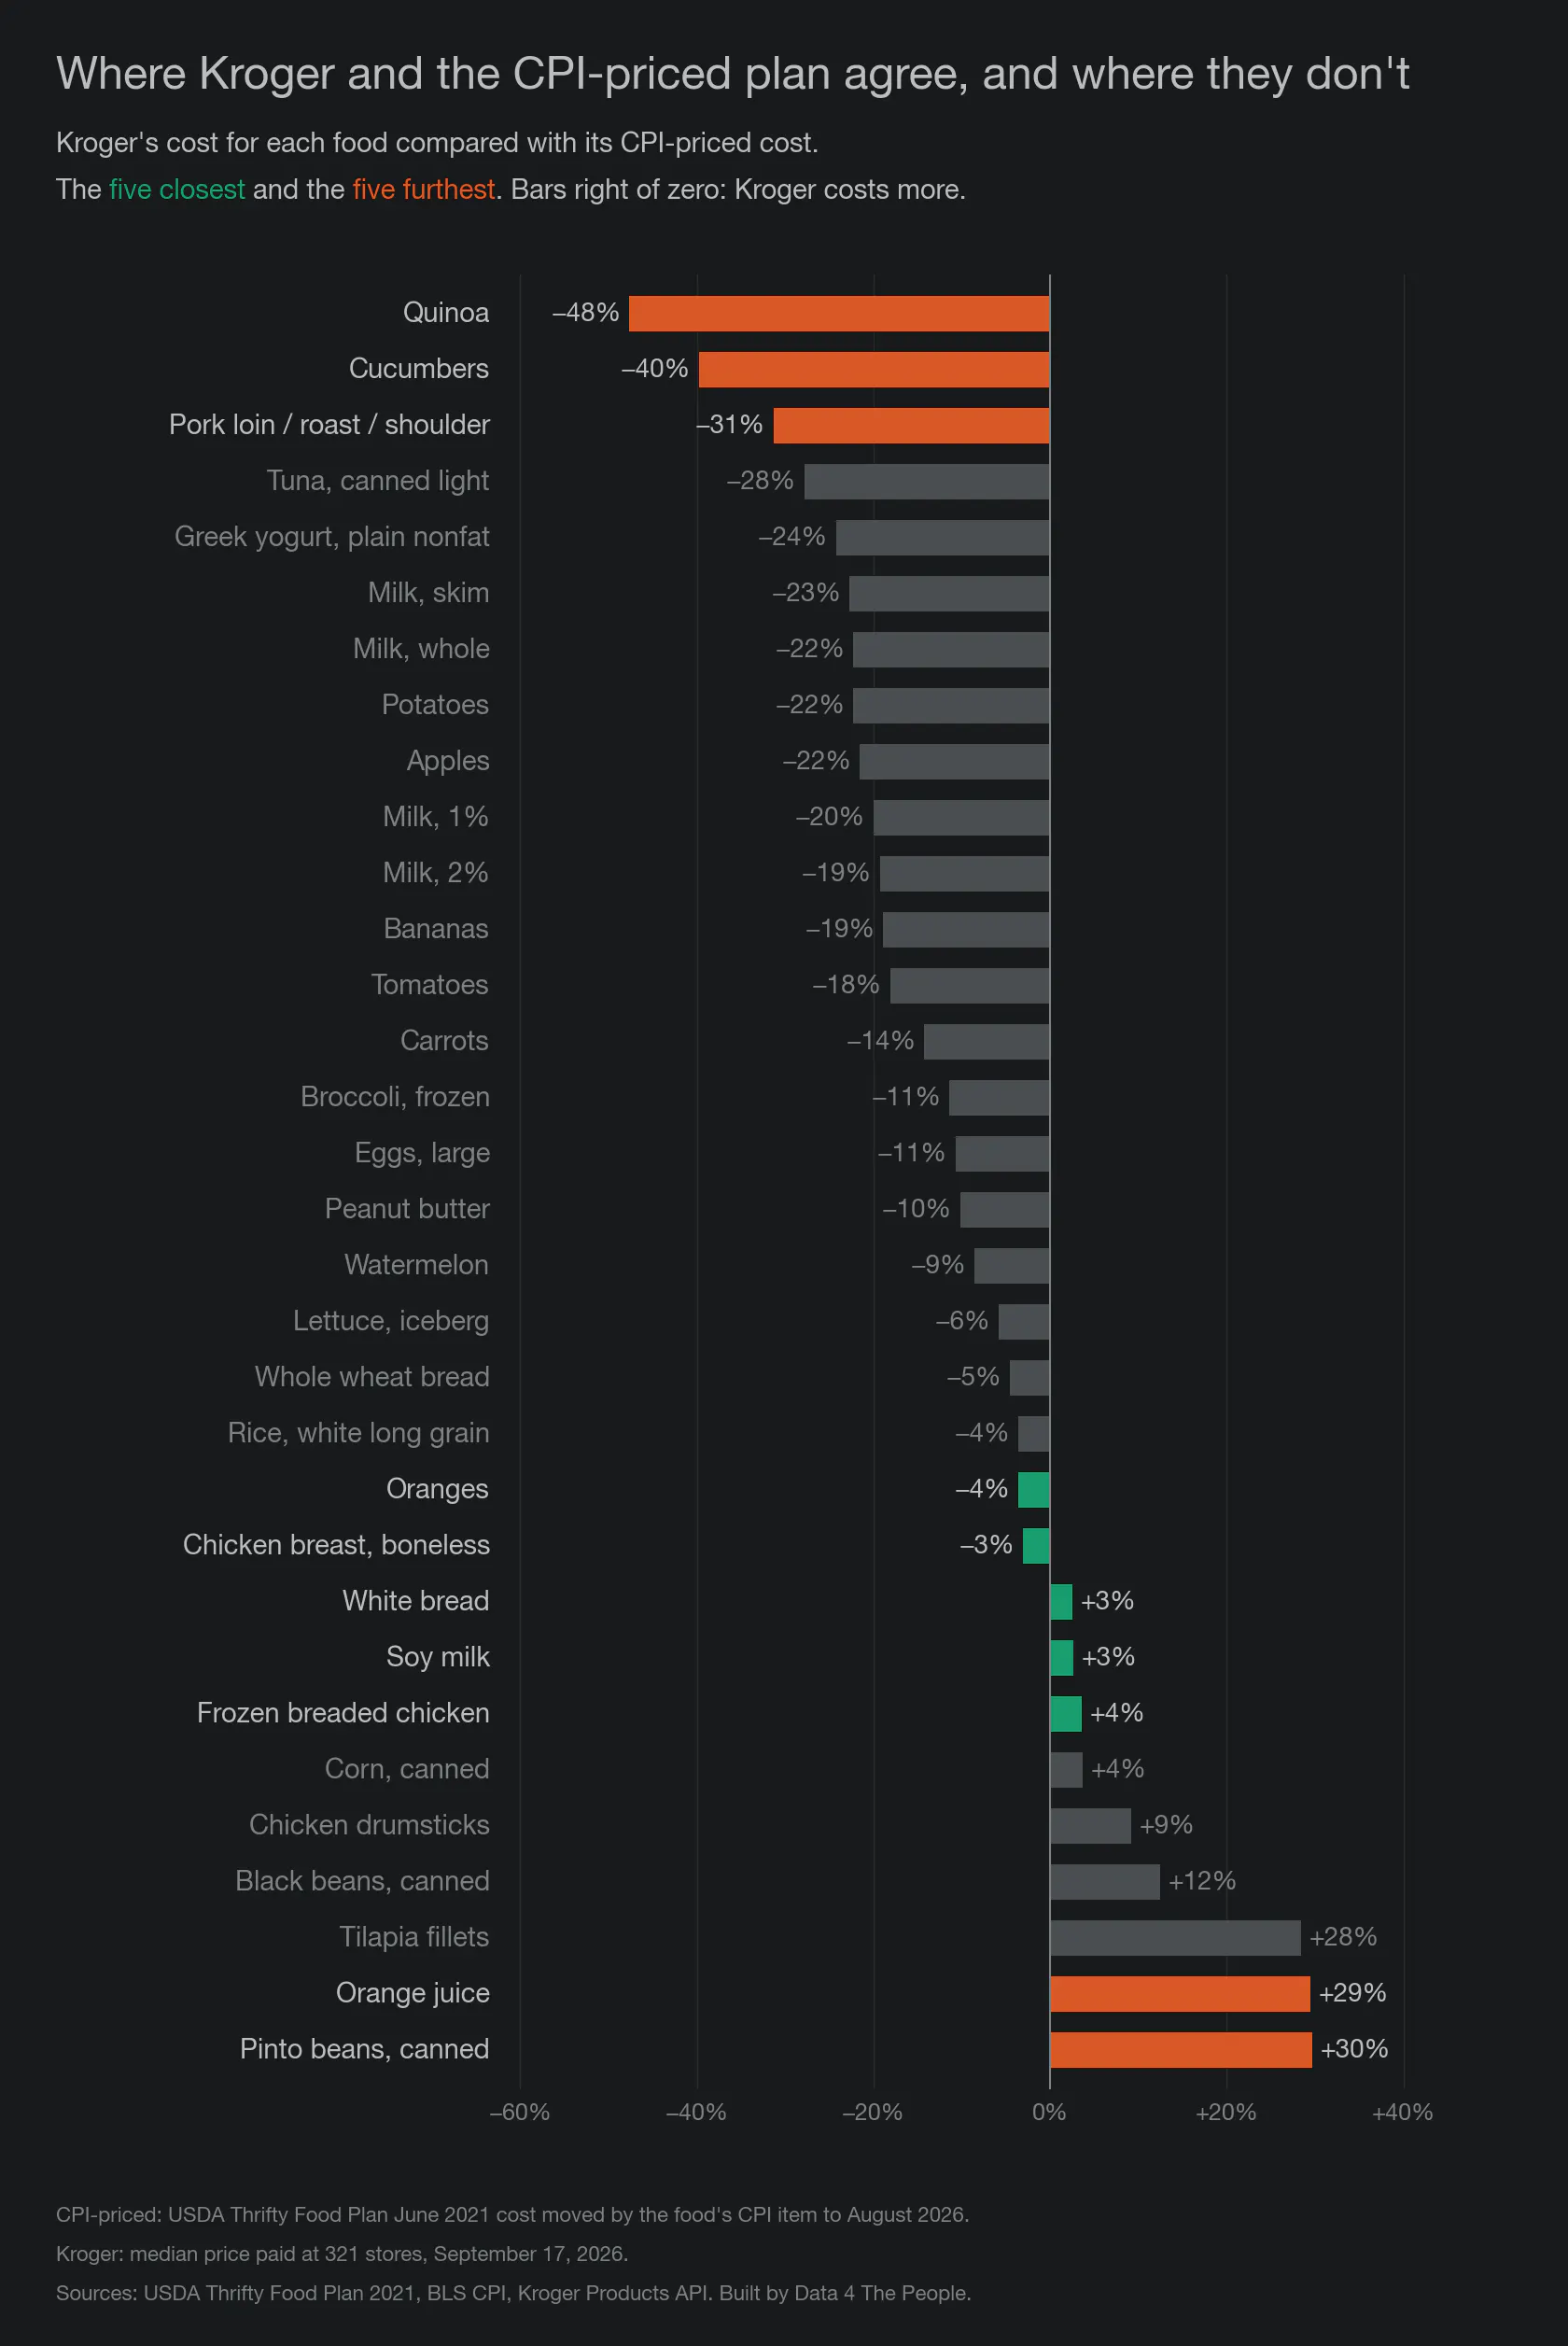
Where Kroger and the CPI-priced plan agree, and where they don’t.
Kroger is cheaper on 23 of the 32 foods. Quinoa is 48% cheaper, cucumbers are 40% cheaper and pork is 31% cheaper. Going the other way, canned pinto beans cost 30% more at Kroger and orange juice costs 29% more. The two biggest items in the basket are close. Whole wheat bread is 5% cheaper at Kroger, and frozen breaded chicken is 4% more.
But do people really eat this way?
Look at the foods we priced, the ones that make up two-thirds of the Thrifty basket. Most of them are basic ingredients: whole wheat bread, apples, carrots, potatoes, milk, eggs, dry rice, canned beans, raw chicken and pork. There are a few shortcuts on the list, like frozen chicken nuggets and peanut butter. But most of it has to be washed, chopped and cooked before it becomes a meal.
How many of us have the time to eat only these foods? And I assume most people reading this have the means and the time to cook. Now put yourself in the shoes of someone who needs food assistance. The Thrifty plan is more than a shopping list. It is what the government uses to set benefits for SNAP, the program once known as food stamps. We have mapped the whole basket and priced it at Walmart and Dollar General before. From October 2025 through September 2026, the most a family of four could get was $994 a month. That is what the plan cost in June 2025. The amount assumes every meal and snack is made at home, from foods like these. How many of those Americans are preparing every single meal from scratch?
So we pulled a few more foods that are more likely to be staples in the American diet: potato chips, chocolate chip cookies, soda, ice cream, ground beef, bacon, American cheese, coffee, butter, spaghetti and three big-name cereals. For 11 of these, the BLS publishes an actual average price in dollars every month, built from the same prices it collects for CPI. We compared that price with Kroger’s. The BLS publishes no dollar price for cereal. So we priced Cheerios, Frosted Flakes and Frosted Mini-Wheats the same way we priced the Thrifty basket: the USDA’s June 2021 price, moved up by CPI for breakfast cereal.
When you look at these foods, we get a different answer. The chart below shows Kroger’s price for each food compared with the government’s price.
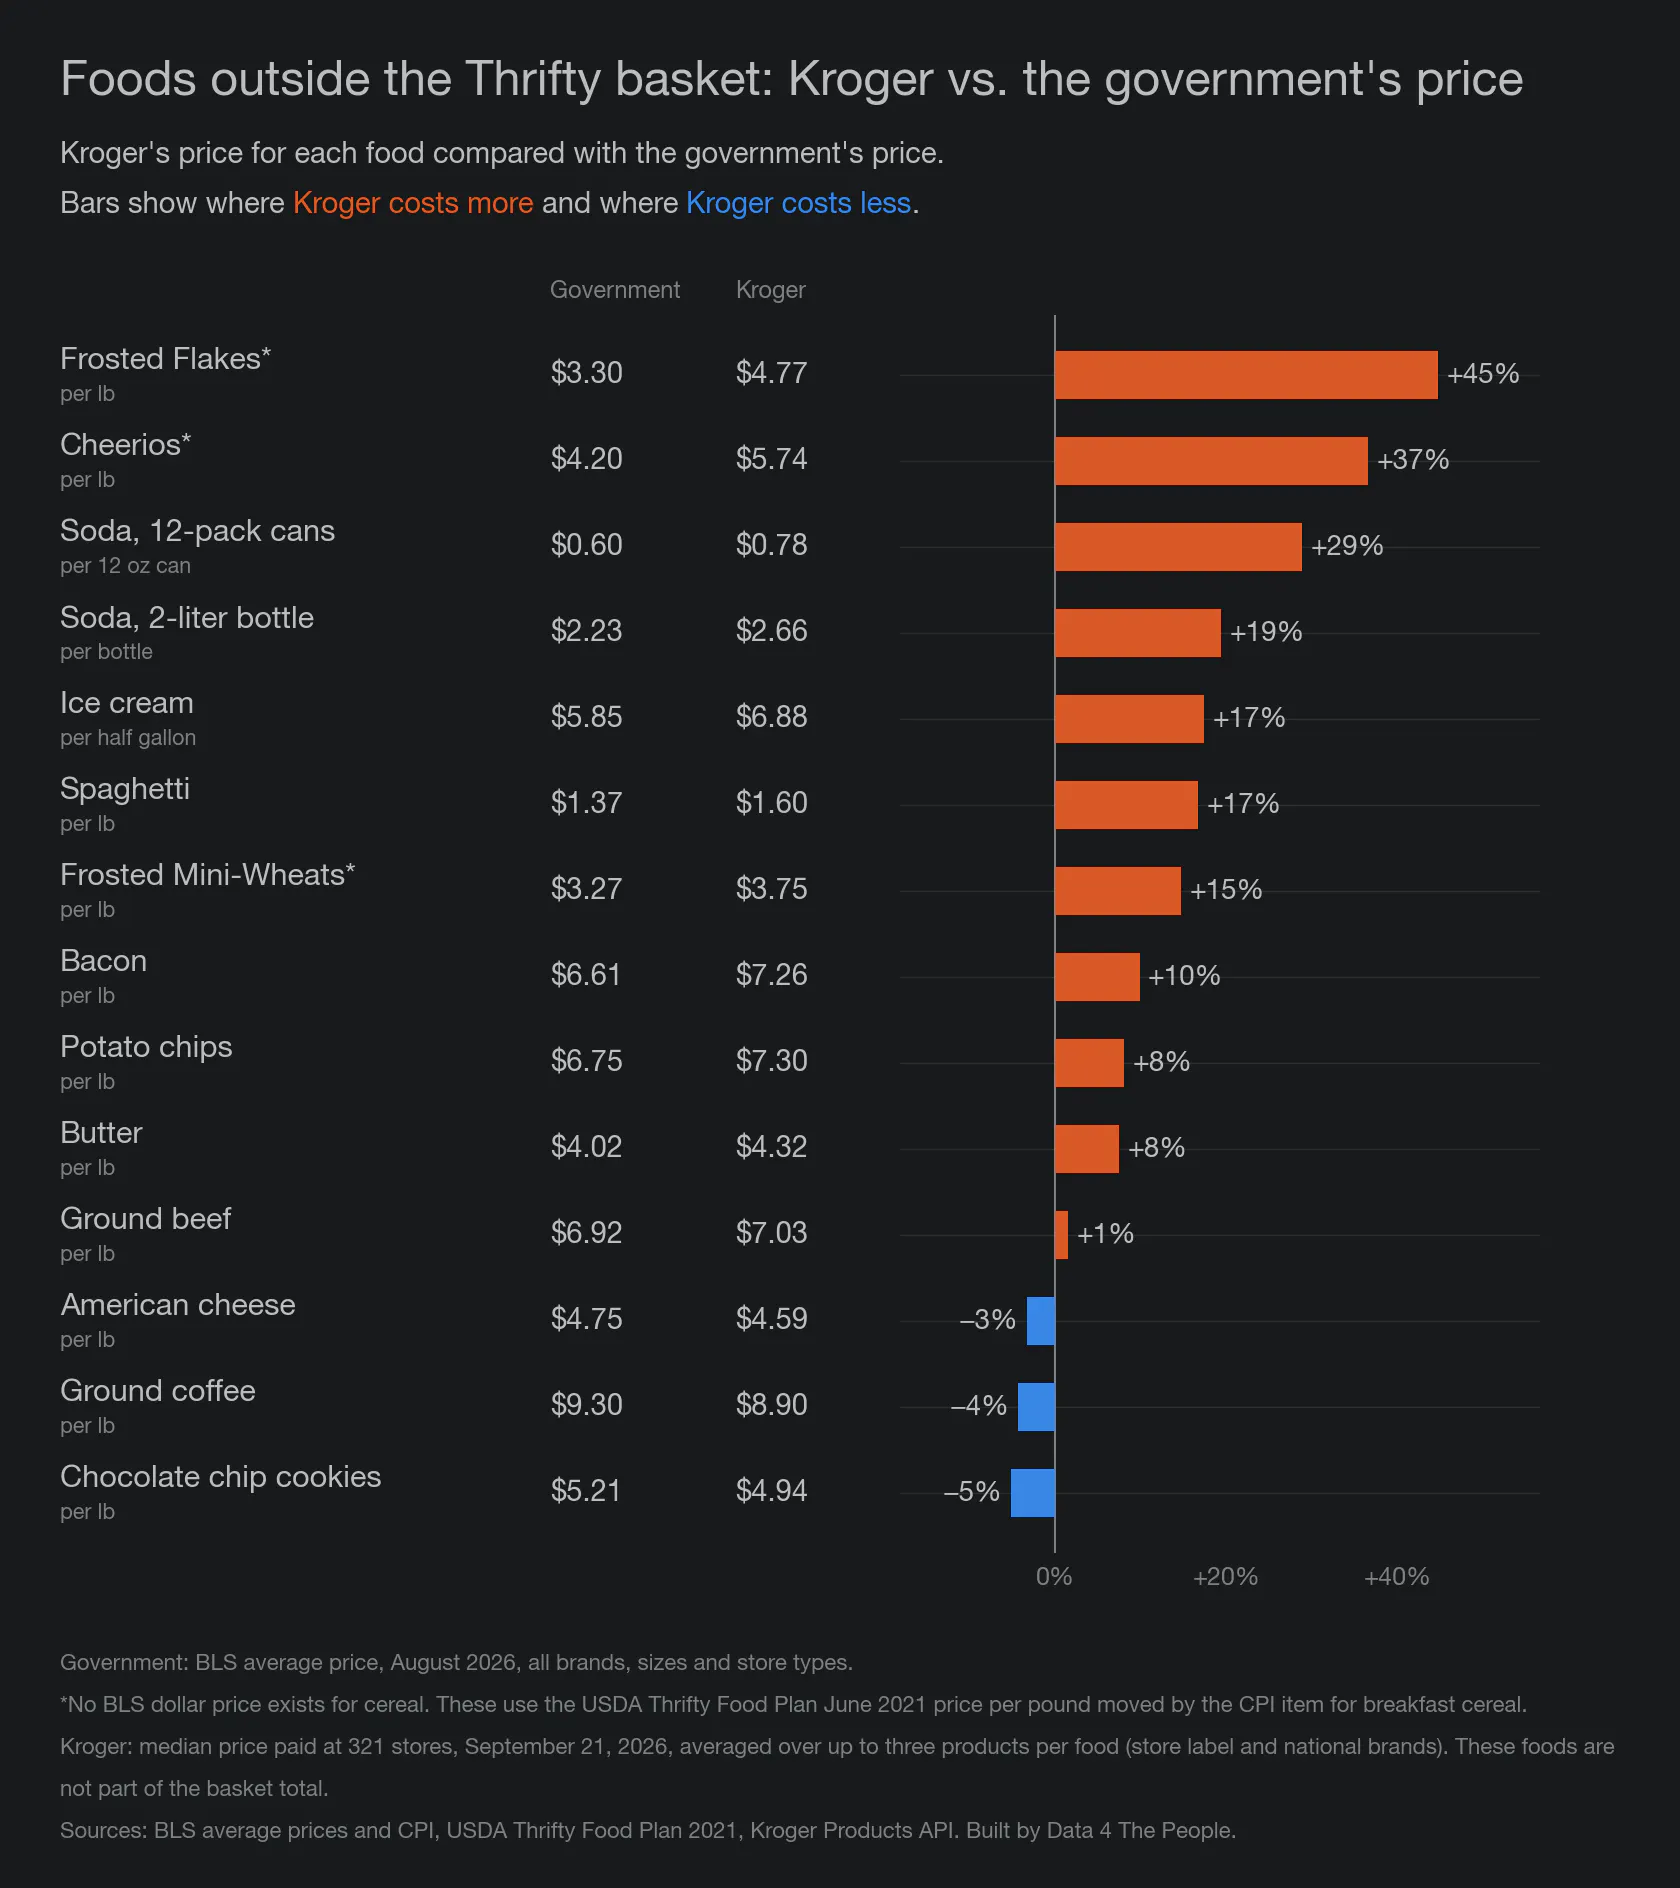
Foods outside the Thrifty basket: Kroger vs. the government’s price. Kroger prices from 321 stores on September 21, 2026.
Most are more expensive than the government’s price: 11 of the 14. Frosted Flakes cost 45% more at Kroger, Cheerios 37% more, and a can of soda from a 12-pack 29% more. Only American cheese, ground coffee and chocolate chip cookies come in lower, by 3% to 5%.
So maybe I was only partly wrong? Maybe if you eat healthy fruits, veggies and grains, you can eat cheaply? Just avoid the middle of the grocery store and shop the outer aisles? That’s the rule of thumb for eating healthy. Maybe it’s also the rule of thumb for saving money?
Not so fast.
It turns out it’s not that simple. If you split Kroger’s products into name brands and private label, you get totally different answers when you compare today’s prices with the government’s prices.
The chart below splits the same 14 foods in two. The left side is Kroger’s private label, which is its own store brand. The right side is the national name brands. Both sides are compared with the same government price as the chart above.
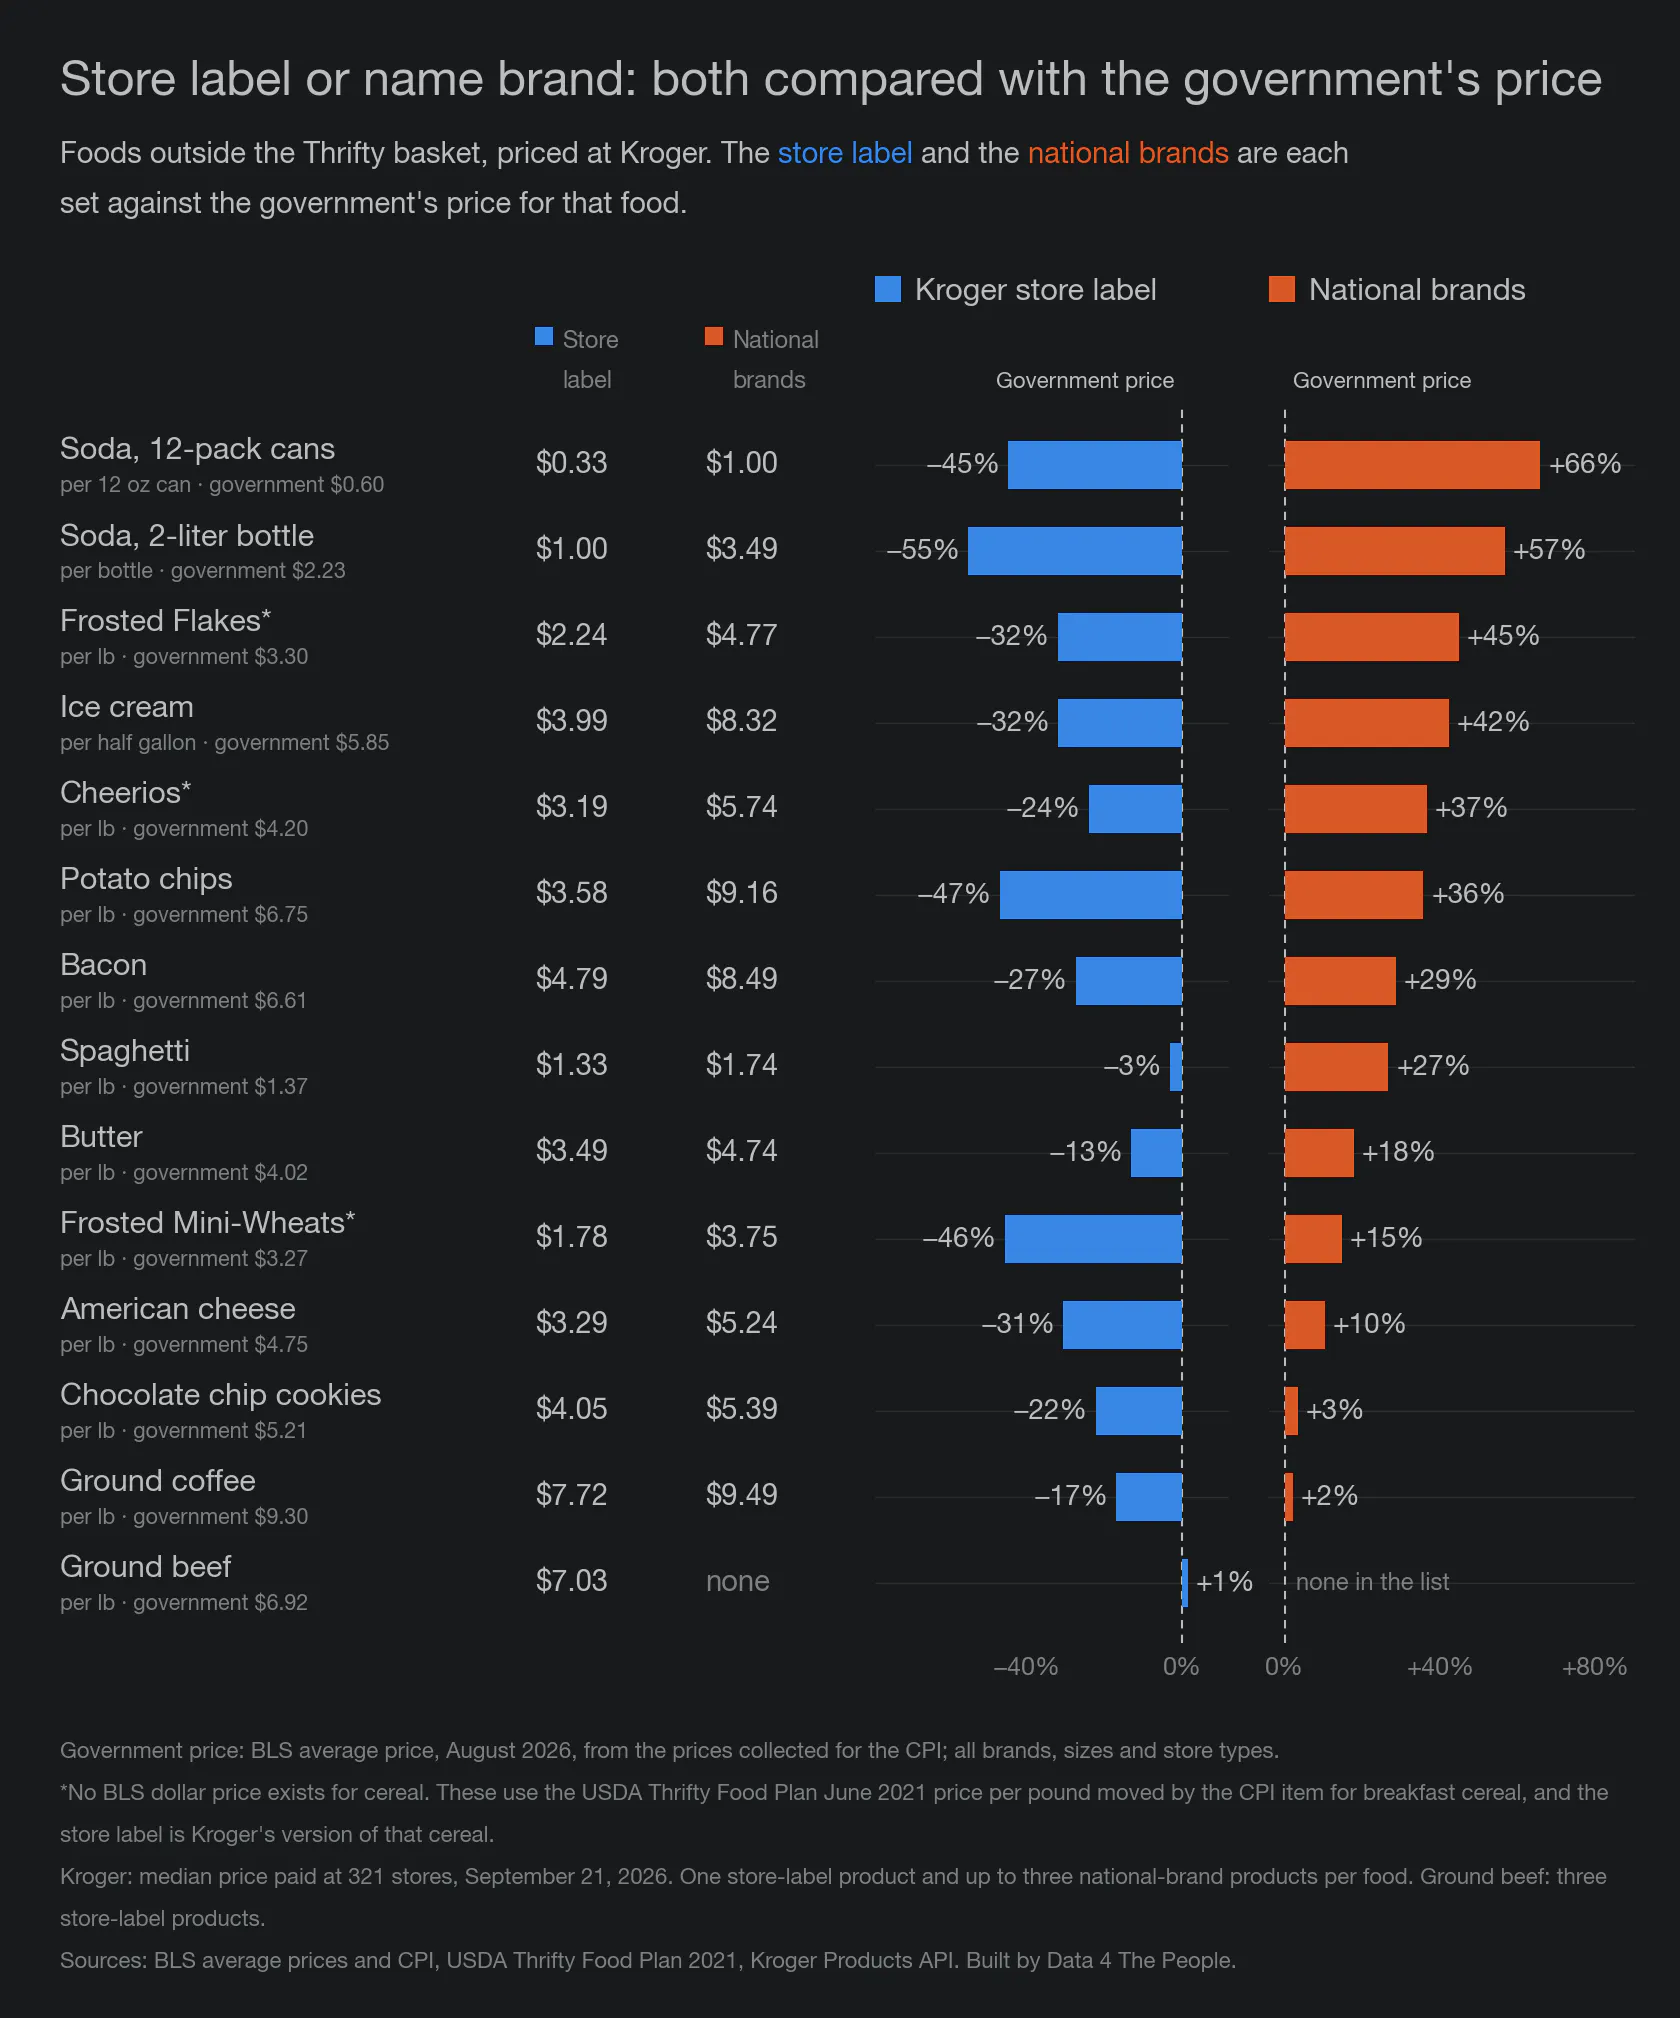
Store label or name brand: both compared with the government’s price. Kroger prices from 321 stores on September 21, 2026.
Every private label product is at or below the government’s price, except ground beef, which is 1% above it. Every national brand is above it. A 2-liter of Kroger’s Big K cola is $1.00, which is 55% below the government’s price of $2.23. A 2-liter of Coke or Pepsi is $3.49, which is 57% above it. On every food where we have both, the government’s price lands between the private label and the national brand.
What have we learned?
First things first. I wrote this piece not only because I think the comparison is important, but also to show that it’s OK to be wrong, as long as you are willing to change your views based on the analysis. That’s the scientific method. You have a hypothesis, and you test it. When it’s wrong, you document that. Science applied to journalism! That’s all we are trying to do here.
Oh, and we also learned that to save money on groceries, if you can, eat fruits, veggies, some meats, and grains. And if you must buy the packaged foods, go with private label. You probably already knew this, but now you have the data to back it up.
How we did this, and what it does not tell you
- Foods and pounds. USDA Thrifty Food Plan, 2021, disaggregated market basket, reference family of four (a man and a woman 20 to 50, children 6 to 8 and 9 to 11). Pounds are as purchased. We used the 32 costliest foods, 65% of the plan’s weekly cost.
- CPI-priced. Each food’s June 2021 cost times the change in its CPI item from June 2021 to August 2026. U.S. city average, not seasonally adjusted. When we price the whole plan this way we get $235.88 a week for August 2026. The USDA’s own figure for July 2026 is $236.50.
- Kroger. Kroger Products API. 83 products for the basket, priced September 17, 2026, and 44 products for the other foods, priced September 21, 2026, at the same 321 stores. Each food is the simple average of its products. We checked every packaged product’s size against the net weight in Kroger’s own product record.
- This compares price levels today. It does not measure Kroger’s inflation. We do not have Kroger’s June 2021 prices. The USDA’s 2021 prices are national averages across all kinds of stores. If Kroger was already cheaper than the national average in 2021, part of the 8.2% gap was there from the start.
- One company. Kroger has no stores in the Northeast, and we priced one store in each area. CPI covers all kinds of stores across the country. We left out Harris Teeter and Ruler stores because their prices could not be matched.
- One-third of the plan is not priced. The other 35% of the Thrifty basket is spread across hundreds of small items.
- Some CPI items are broad. Carrots and cucumbers both move with “other fresh vegetables,” and quinoa moves with “rice, pasta, cornmeal.” Several of the biggest gaps are in foods like these.
- Produce sold by the each. Lettuce, cucumbers and watermelon are turned into pounds with typical USDA weights. These three foods are about $6 of the $140.
- BLS average prices mix everything. They cover all brands, sizes and store types. For most foods, our Kroger figure is one private label product and two national brands, counted equally. The cereals are name brand only, and ground beef is private label only. The split chart shows how much that mix matters. Each private label figure rests on one product.
- Sales. We see the posted sale price. Multi-buy deals and digital coupons do not show up in the data.
Common questions
Is CPI accurate for grocery prices?
For the foods we tested, CPI did not understate prices. We priced 32 foods from the USDA Thrifty Food Plan with CPI and got $152.71 a week for a family of four. The same foods cost $140.17 at Kroger on September 17, 2026, which is 8.2% less. This compares price levels on one day at one company. It does not measure how Kroger’s prices have changed over time.
How much does the Thrifty Food Plan cost in 2026?
The USDA put the plan at $1,025 a month, or about $237 a week, for a family of four in July 2026. The USDA updates the cost every month with CPI. The plan assumes every meal and snack is made at home.
Does the Thrifty Food Plan set SNAP benefits?
Yes. The plan’s cost each June sets the maximum SNAP benefit that starts the following October. The June 2025 cost was about $994 a month for a family of four, and $994 was the maximum benefit from October 2025 through September 2026.
Are store brands cheaper than name brands at Kroger?
On the 13 foods where we priced both, yes, every time. Kroger’s store brand ran from 3% to 55% below the government’s price. The national brands ran from 2% to 66% above it. A 2-liter of Kroger’s Big K cola was $1.00, and a 2-liter of Coke or Pepsi was $3.49.
Support Data That Serves the Public
Data should empower people, not just institutions. Your support helps us create accessible research, visualizations, and tools that uncover economic inequality and inform better decisions.
Donate
Enjoying this post?
Tell others about it.
More articles like this
Fetching Related Posts
There are no other articles tagged with Data 4 Thought