
Benchmarking JobsOhio's Target Industry Growth
How we measured it: data, definitions, and the judgment calls behind the analysis

Eric Pachman
Published
June 24th 2026
Purpose
This analysis answers a question JobsOhio has never answered itself: did the industries it set out to grow actually keep pace?
When Ohio created JobsOhio in 2011, it named the sectors it would target and set itself an explicit goal. In its own words, the organization holds "a vision to consistently lead the nation in private sector job growth." That is a measurable claim. This analysis measures it.
JobsOhio reports its results in terms of its own deals — jobs that companies receiving its incentives pledged to create. What it does not report is the counterfactual: how the industries it targeted actually performed against the same industries elsewhere. A program can announce deal after deal and still preside over a sector that is losing ground to other states. The only way to know is to measure the industries themselves, against an external benchmark, over a fixed window. That is what this tool does.
What this page is
Every chart we publish should be something you can check, question, and rebuild yourself. This page documents every decision behind the benchmark: the data source, how we translated JobsOhio's target sectors into specific industry codes, how many of those codes we could actually measure and how much employment they cover, how we built each comparison, and the judgment calls we made along the way. None of it is proprietary. The industry definitions are JobsOhio's own; the classification is standard NAICS; the data is public; the math is arithmetic.
We are also direct about what we don't know. Where we made a judgment call, we say so. Where a benchmark has a limitation, we name it.
The data source
We use a single public series, the Quarterly Census of Employment and Wages (QCEW) from the U.S. Bureau of Labor Statistics — a near-complete count of jobs drawn from state unemployment-insurance records, granular enough to reach the 6-digit NAICS codes that define JobsOhio's target industries. We use private-sector employment (QCEW ownership code 5) and compare annual average employment in 2013 against 2025. We pull the same data for Ohio and for all other states, which lets us benchmark each Ohio industry against the same industry elsewhere.
We start the clock in 2013 because that is when JobsOhio became operational, not merely legal. The legislature created JobsOhio in 2011, but the organization had no independent funding until early 2013, when its affiliate, the JobsOhio Beverage System, acquired Ohio's liquor franchise under a 25-year lease formalized on January 4, 2013, and issued roughly $1.5 billion in revenue bonds to pay for it. Those liquor profits are JobsOhio's sole funding source; by its own account, it "became funded in 2013." Measuring from 2013 therefore measures the program from the point it actually had the resources to operate, rather than crediting or blaming it for employment movements in 2011 and 2012, before its funding model existed. A 2013 start also avoids an earlier NAICS reclassification of one of the larger codes in the target list (Services for the Elderly and Persons with Disabilities, 624120), giving a consistently classified series for every industry.
We are direct about the trade-off this involves. JobsOhio's own headline success claim reaches back to 2010, so a reader should understand that our window does not capture the program's earliest period. To the extent JobsOhio drove gains before 2013, this analysis does not credit them. We think 2013 is the right start because it marks when the funded program actually began, but the choice is a judgment call, and the result should be read with that boundary in mind.
From 103 industries to 83: what we can measure
JobsOhio names 103 six-digit NAICS codes across ten target sectors. Not all of them can be measured cleanly, and the path from 103 to the 83 we analyze is the single most important thing to understand about this study.
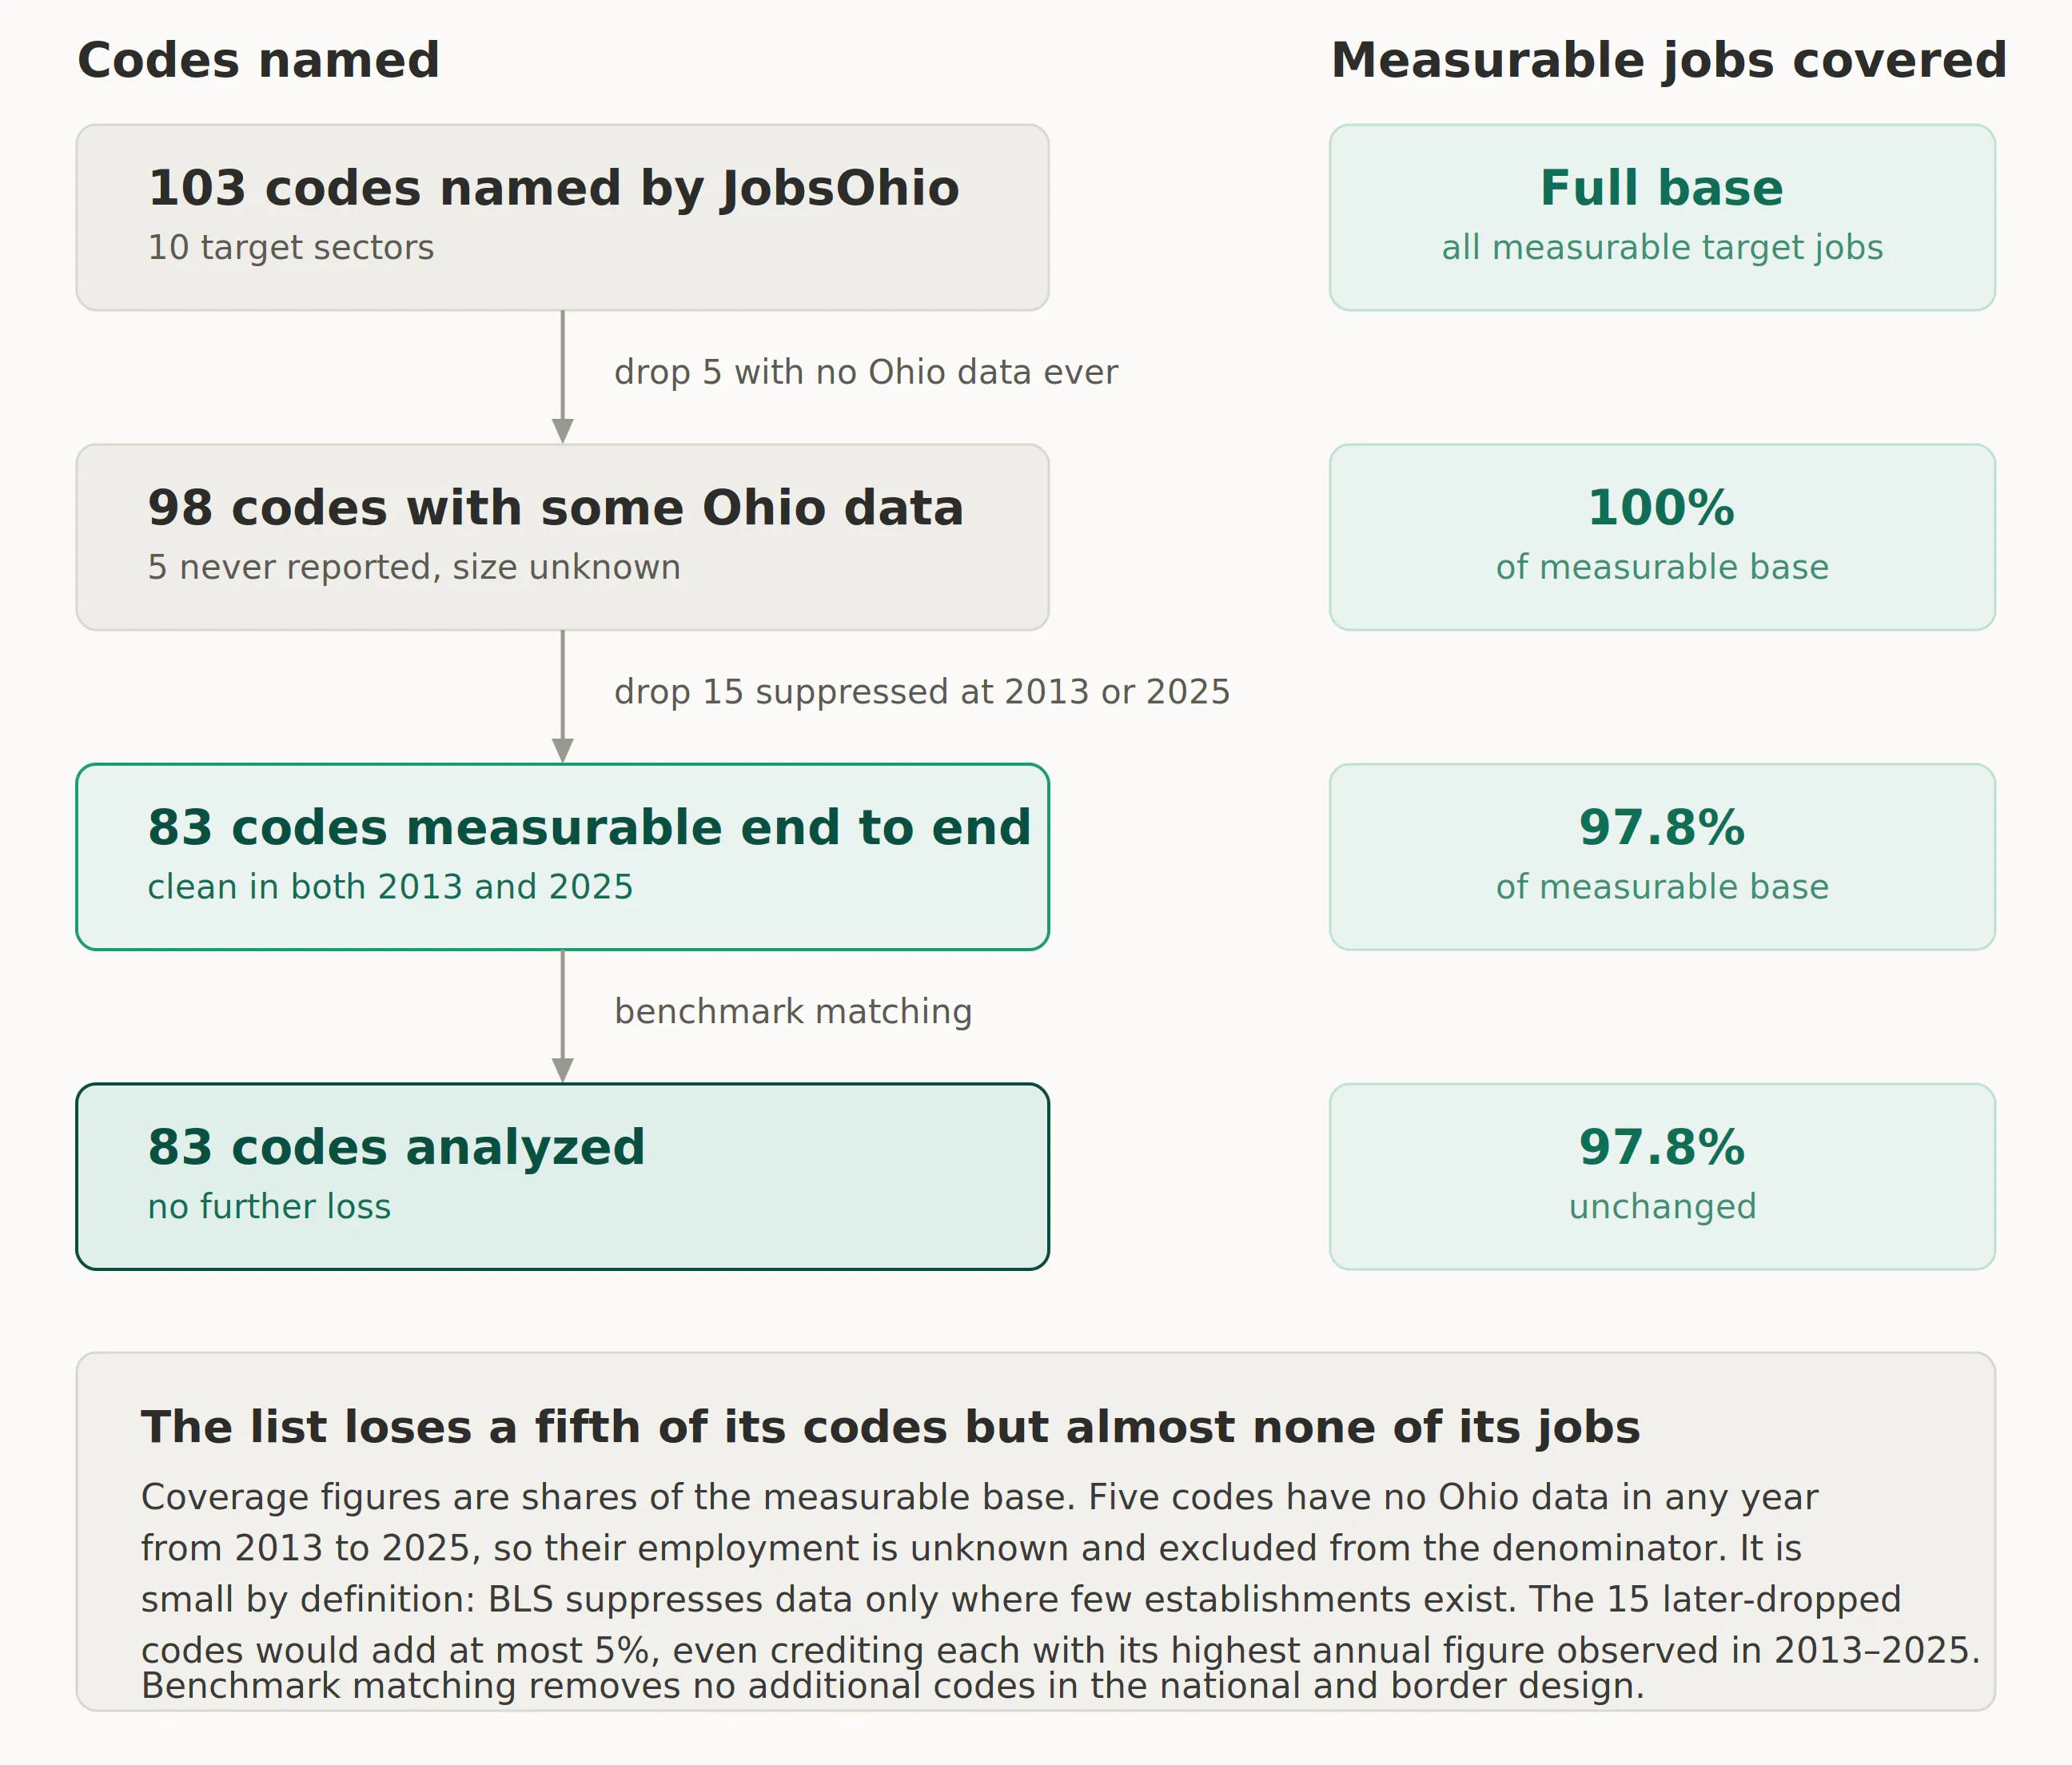
The list narrows in two steps, both driven by data suppression rather than any choice of ours. BLS suppresses employment figures for a state-industry cell whenever publishing them would reveal an individual employer — which happens precisely where an industry is small or concentrated in a state.
First, five of the 103 codes have no usable Ohio employment in any year from 2013 to 2025. These are industries that are essentially absent from Ohio or are government functions rather than private employers — the three Federal Installations codes, Space Research and Technology, and Seafood Product Preparation. Because they never report, their employment is genuinely unknown to us, and we exclude them from every coverage figure rather than guess. But unknown does not mean large: BLS suppresses only where few establishments exist, so by construction these are small.
Second, fifteen more codes report some Ohio data but are suppressed in either 2013 or 2025, which makes a start-to-end comparison impossible. That leaves 83 codes measurable from end to end.
Here is why losing twenty codes matters far less than it sounds. The 83 codes we keep account for 97.8% of all measurable target-sector employment in Ohio in 2025. The codes we drop are overwhelmingly tiny. To put a hard ceiling on what they could represent, we took each of the fifteen partially-suppressed codes and credited it with the highest annual employment it reached at any point in our 2013–2025 window — a deliberately generous overstatement, since most were well below that peak by 2025. Even on that generous accounting, the dropped codes would add at most 5% to the base. We lose a fifth of the codes but almost none of the jobs, because suppression falls on the smallest industries.
A final point on this funnel: in the design we publish — the national benchmark and the border comparison — matching Ohio's industries to peer states removes no further codes. The narrowing is entirely the suppression steps above. All 83 measurable codes carry through to the analysis.
Why we benchmark against the nation
JobsOhio set a national standard for itself, so the nation is the standard we hold it to.
This is not a benchmark we imposed from outside. The organization's stated vision is to "consistently lead the nation in private sector job growth." The most concrete success metric ever attached to the program — cited in a McKinsey account of its work with JobsOhio — is a national ranking: Ohio is said to have ranked 49th among states in target-sector job growth in 2010 and risen to 20th by 2022. Whatever one makes of that figure, it establishes the yardstick in JobsOhio's own terms. If the goal is to lead the nation, the relevant comparison is the nation.
We could not reproduce the 49th-to-20th figure, because the methodology behind it has never been published — which years, which precise measure of "growth rate," which treatment of suppressed data. Rather than try to reverse-engineer an undisclosed number, we built a transparent comparison of our own and report exactly how. (Our independent reconstruction of Ohio's national rank is documented in the "National rank" section below.)
How the benchmark is calculated
Before any refinements, the core comparison is simple arithmetic. For each industry, we ask: if Ohio's employment in that industry had grown at the same rate as its peer states, how many jobs would it have in 2025? Then we compare that expected figure to what Ohio actually has.
The calculation has three steps, done separately for every one of the 83 industries:
First, we find the peer benchmark growth rate. For a given industry, we take each peer state's growth rate in that same industry from 2013 to 2025 — its own 2025 employment minus its 2013 employment, divided by 2013 — and take the median across those states. We use the median rather than the average so that one state with an enormous or volatile swing cannot drag the benchmark; the median reflects the typical peer state.
Second, we apply that rate to Ohio's starting point. We take Ohio's actual 2013 employment in the industry and scale it up (or down) by the peer median rate. If Ohio had 30,000 jobs in an industry in 2013 and the peer median grew 20%, Ohio's expected 2025 employment is 36,000.
Third, we compare expected to actual. The gap between Ohio's expected 2025 employment and its real 2025 employment is the finding for that industry. Positive means Ohio outgrew its peers; negative means it fell short. Summing those gaps across industries gives the sector and overall totals.
Two deliberate choices are worth stating. We benchmark each state's rate independently and then take the median, rather than pooling all peer employment into one big numerator and denominator. Pooling would let the largest states dominate the benchmark; the independent-median approach gives each state equal weight, so the benchmark reflects the typical state's experience rather than California's or Texas's. And we never include Ohio in its own benchmark — the peer median is always computed from other states only.
Everything that follows — the size adjustment, the all-states-versus-comparable-states views — is a refinement of step one: which peer states belong in that median. The arithmetic of steps two and three never changes.
Size-adjustment: comparing Ohio to states its own size
A median across all states has a hidden bias, and correcting it is the central methodological choice in the national benchmark.
The problem is that smaller employment bases grow faster in percentage terms. An industry that employs 300 people in a state can double to 600 far more easily than Ohio's 30,000-person industry can. This is a well-documented regularity in economics — the failure of Gibrat's Law — and it is clearly present in our data. We confirmed it three ways: the rank correlation between a state's size in an industry and its growth rate is negative and holds in roughly three-quarters of the codes; the median growth rate of states comparable to Ohio in size runs about four percentage points below the all-states median; and a regression of growth rate on log employment shows a significant negative slope in 60% of codes.
Left uncorrected, this bias inflates the benchmark — it holds Ohio to the growth rate of states far smaller than it, which can post high percentages off small bases that Ohio's scale makes unattainable. So we offer two views, and the reader can switch between them:
The all-states view applies the median growth rate of every state with usable data in a code to Ohio's 2013 base. It is simple and complete, but carries the small-state bias described above.
The size-adjusted view restricts each industry's benchmark to states whose 2013 employment in that specific code falls between one-third and three times Ohio's. The match is made independently for every code: a state can be Ohio's size in motor-vehicle parts but not in warehousing, and it is included for the one and not the other. This compares Ohio only to states with a similar-scale presence in each industry.
The two views tell the same directional story and differ in magnitude. Across the 83 codes, the all-states benchmark puts Ohio roughly 51,600 jobs below its expected 2025 employment; the size-adjusted benchmark puts it roughly 17,900 below. Ohio lags either way — the size adjustment changes how much, not whether. We show both precisely because the honest finding is that the direction is robust and the magnitude depends on a defensible methodological choice. Hiding the choice would be the less honest path.
We also tested a third, more elaborate approach and rejected it. Rather than matching on size, one can regress growth rate on size across all states and read off the rate the model predicts for a state of Ohio's scale. We tried this and discarded it, because Ohio is larger than 90% of states in more than a third of the codes. In those codes the model is no longer interpolating between comparable states but extrapolating past the edge of the data, where it produces impossible values — predicted growth rates below −100% in some codes, implying negative employment. A method that breaks down precisely because Ohio is unusually large is the wrong tool here. Documenting why we rejected it is part of the record.
The border-state comparison: a different kind of question
The national benchmark answers whether JobsOhio met its own goal. The border comparison answers a question people in Ohio actually ask: how did we do against the states next door?
This view is deliberately different from the national one, and the difference is the point. There is no model here, no expected value, no size adjustment. We simply place Ohio's actual growth rate in each industry beside the actual growth rate of each of its five neighbors — Indiana, Kentucky, Michigan, Pennsylvania, and West Virginia. Nobody's growth rate is applied to anyone else's employment base. The chart shows parallel facts and lets the reader compare them directly.
We made this choice because the modeling that makes sense for fifty states does not make sense for five. Applying one small neighbor's volatile growth rate to Ohio's much larger base would not be meaningful, and with only five states there is no stable distribution to take a median of. The most honest thing to show is the unadorned comparison.
This is why the hover detail is not a convenience but a core part of the method. Growth rates alone can mislead across states of different sizes — West Virginia's warehousing employment growing by a third sounds dramatic until you see it rose from about 2,700 jobs to 3,600. Every point in the border view reveals, on hover, the absolute employment behind the rate: the 2013 level, the 2025 level, and the change. The reader sees both the percentage and the scale it rests on, and can weigh a small state's large percentage accordingly. The transparency about base size is built into the interaction.
How the sector totals are built
Each sector figure is a bottom-up sum of its component industries, not a separate top-line number.
This is not merely a cleaner way to aggregate — it is the only way to measure what JobsOhio actually named. JobsOhio did not target whole 2-digit sectors; it named specific 6-digit industries within them. If we measured a sector by pulling its 2-digit NAICS total straight from the data, we would sweep in dozens of granular industries JobsOhio never called out, and the comparison would no longer be about the program's own targets. Building each sector from only the specific codes on JobsOhio's list keeps the measurement faithful to what the program said it would grow, and nothing else. Take "Healthcare" as the clearest case: the 2-digit health and social-assistance total covers hundreds of thousands of jobs across hospitals, physician offices, and dozens of other industries, while JobsOhio named a far narrower set of healthcare-related codes. Counting the former would measure something JobsOhio never claimed responsibility for.
This also governs how the benchmark is computed within a sector. We do not take a sector's total and apply one blended growth rate to it. Instead, every individual NAICS code receives its own peer benchmark — its own median peer growth rate applied to its own 2013 Ohio base — and the sector's expected employment is the sum of those individual expected values. A sector that contains both a fast-growing peer industry and a shrinking one reflects each at its own rate, rather than smearing a single average across the whole group. When you see a sector bar, you are seeing the sum of the granular comparisons beneath it, which is exactly what you get if you drill into that sector and add up its industries.
National rank: how we get 25th to 31st of 50
JobsOhio's own success claim is a national rank, so we reconstructed Ohio's rank independently. The headline finding: across every defensible construction covering at least 40 of the targeted industries, Ohio ranks between 25th and 31st of the 50 states in target-sector job growth from 2013 to 2025 — at or just below the median, not the top tier.
Ohio's rank depends on one analytical choice: how widely an industry must be reported before we include it in the comparison. Some of the 83 target industries are reported cleanly by nearly every state; others are suppressed in many states. Requiring an industry to be widely reported makes the comparison more apples-to-apples — every state measured on the same basket — but it also throws out the more specialized industries JobsOhio named. Rather than pick one cutoff and defend it, we ran the full range and report Ohio's rank at each.
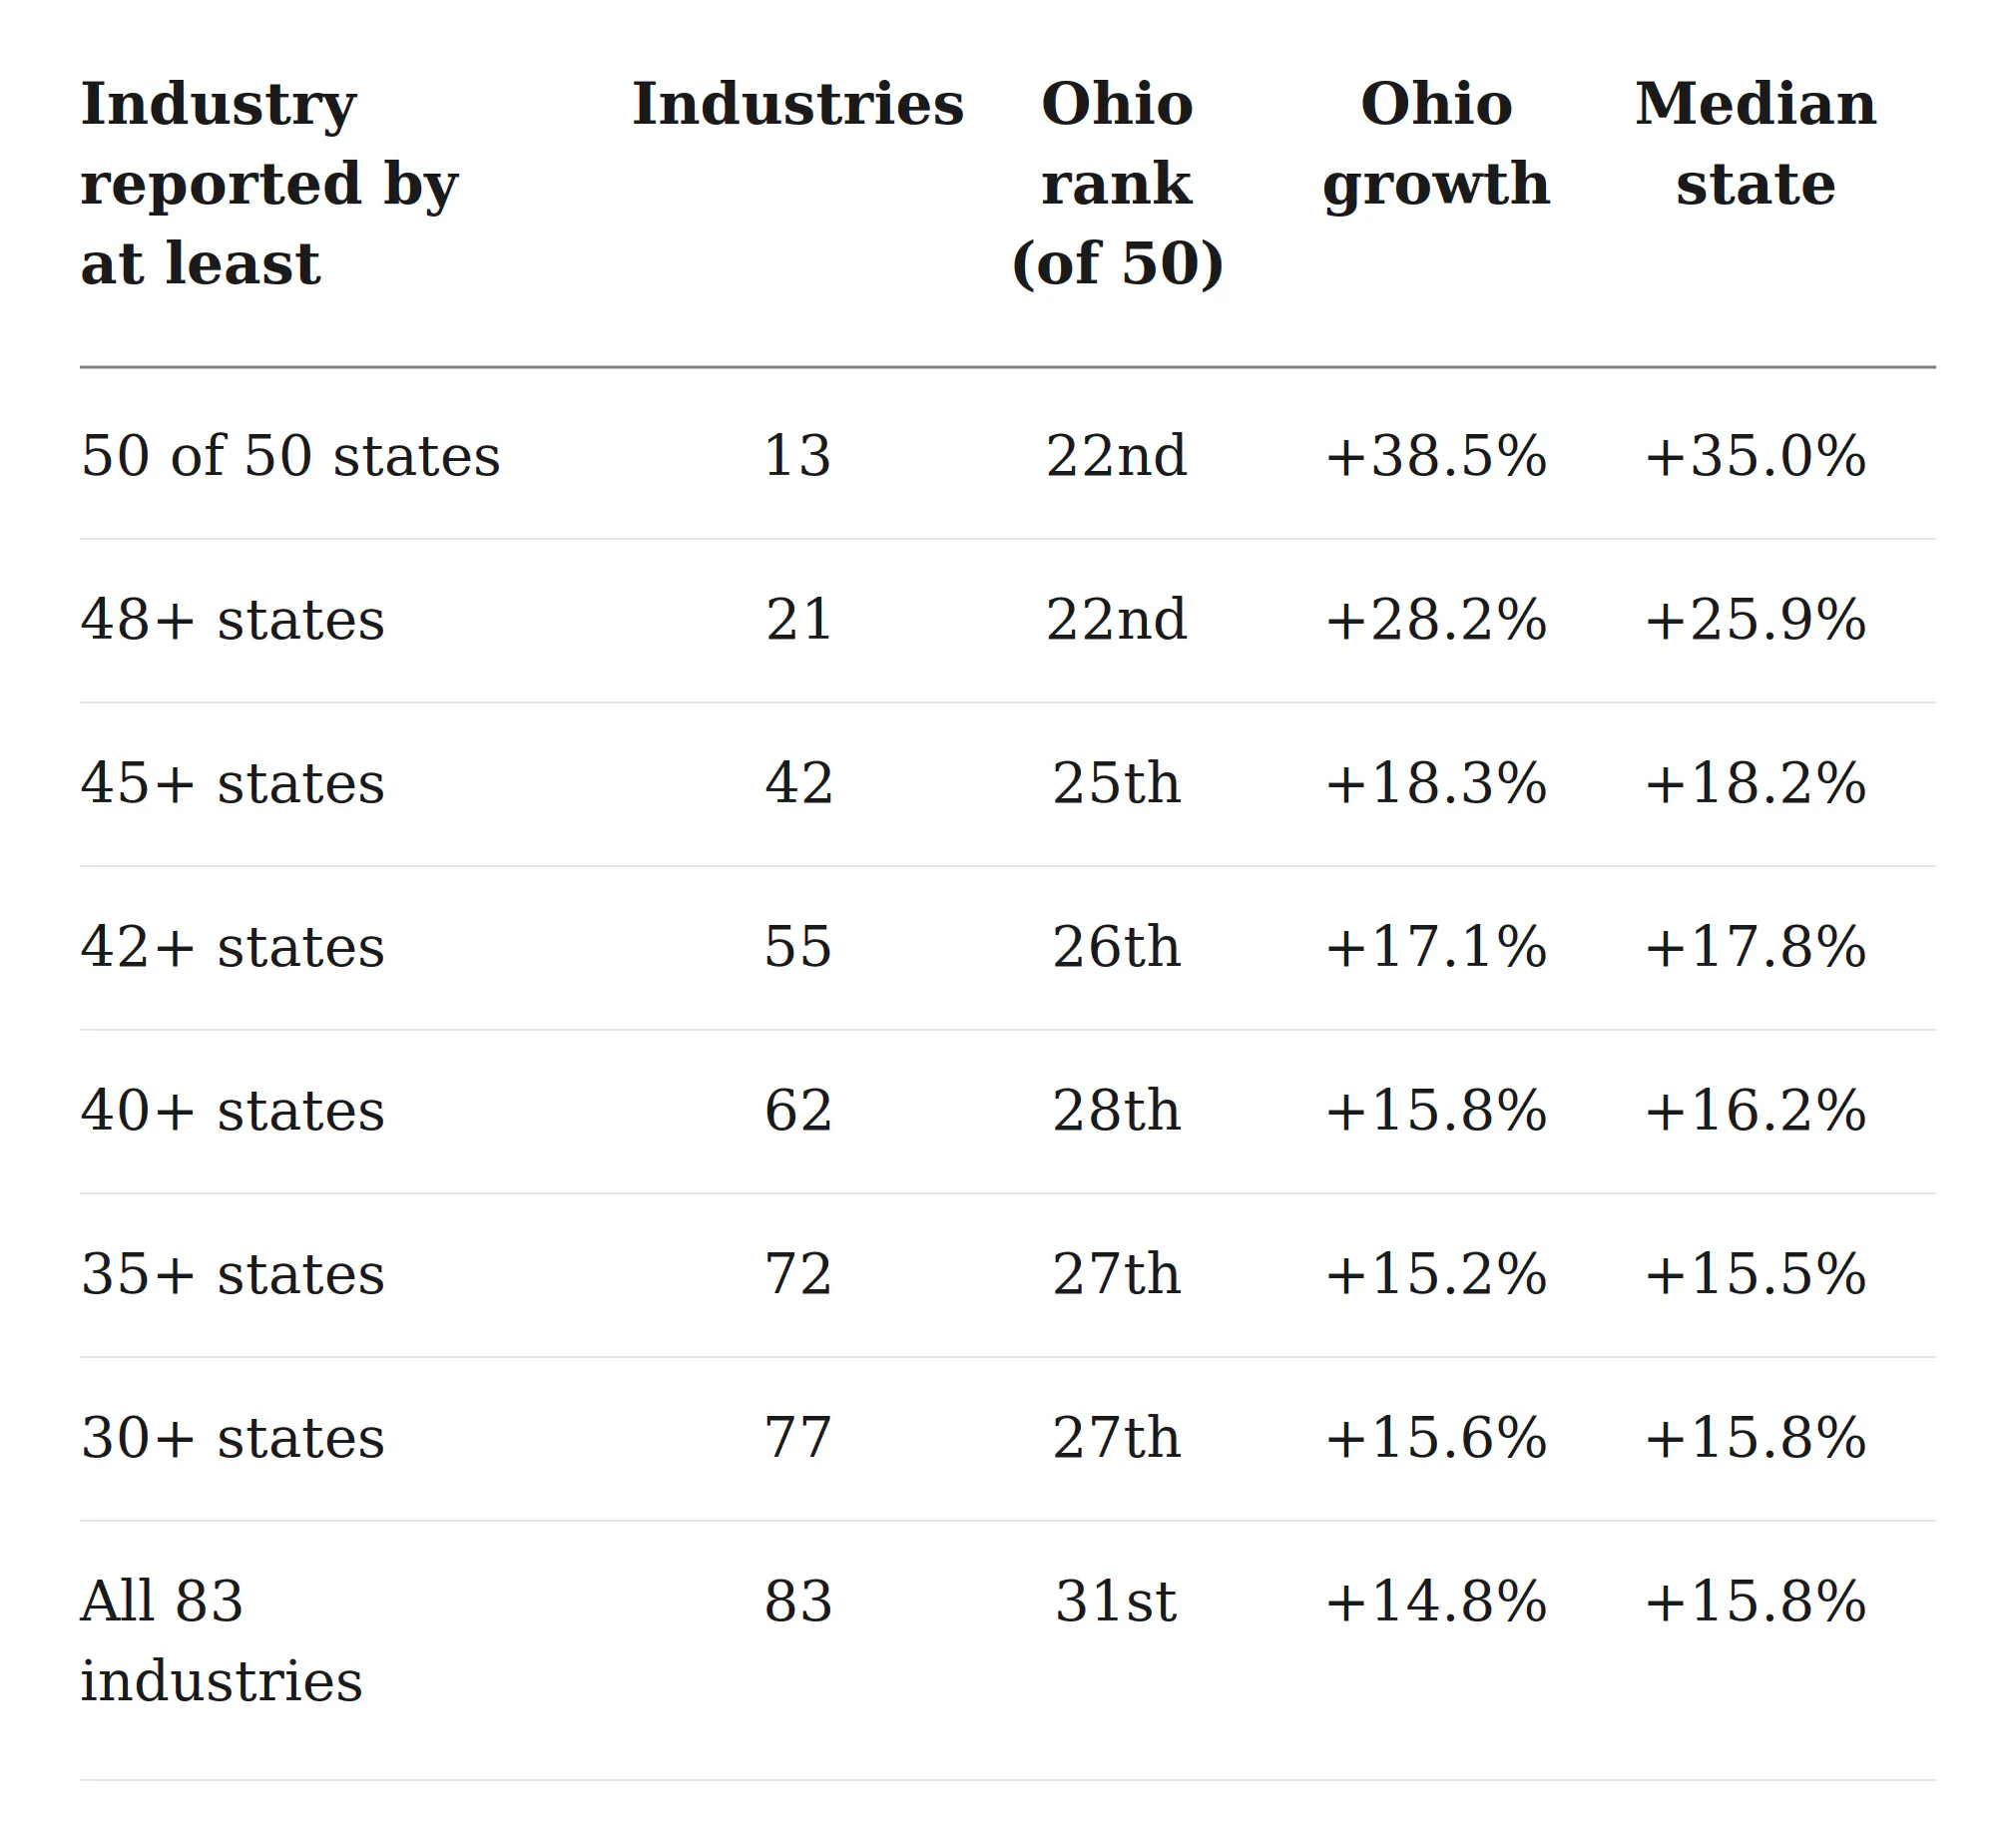
The top rows of that table look better for Ohio, but they rest on almost no coverage, and it is worth being precise about why. Requiring an industry to be reported by 50 of 50 states means every state — including the smallest, like Wyoming, North Dakota, and Vermont — must have clean, unsuppressed data for that industry in both 2013 and 2025. Very few industries clear that bar: only the largest, most universal ones, the kind that exist at scale in every state. That is why the list collapses from 83 industries to just 13. Thirteen of JobsOhio's named industries is a poor representation of the program's target list, and they are precisely the industries where Ohio's size works in its favor. The 22nd-place result is real arithmetic, but it describes a sliver of the targets, not the whole.
Motor Vehicle Manufacturing shows exactly how this skews the ranking upward for Ohio. It is one of the industries JobsOhio named, and Ohio did poorly in it: employment fell from about 20,700 jobs in 2013 to about 19,000 in 2025, a decline of roughly 8%, while the median state in that industry grew 95% over the same period — a gap of more than 100 percentage points, the worst of any industry on JobsOhio's list. But motor vehicle manufacturing is concentrated in relatively few states, so only 19 of the 50 report it cleanly. At any threshold requiring broad reporting, this industry drops out of the comparison entirely. Excluding one of Ohio's most conspicuous failures mechanically lifts its rank. The stricter the reporting requirement, the more industries like this one disappear, and the better Ohio looks — not because it performed better, but because its worst results are no longer being counted.
The pattern across the rest of the table is the finding. As soon as the comparison includes a representative share of the industries JobsOhio actually named — anywhere from 42 to 83 of them — Ohio settles into a narrow band between 25th and 31st of 50, with a growth rate within about a percentage point of the median state's at every cutoff. The rank barely moves no matter where in that broad middle range the threshold is set. Whichever reasonable cutoff one picks, the conclusion is the same: on the industries JobsOhio chose to grow, Ohio is a median state, not a leader. It looks above the median only when the comparison is narrowed to the dozen-odd industries big enough to appear in every state.
Two honest caveats apply to the rank specifically. It is not a replication of JobsOhio's 49th-to-20th claim, which uses an undisclosed method and a different time window; it is an independent measure that happens to test the same question. And like the rest of the analysis, it starts in 2013, which understates whatever gains occurred in JobsOhio's earliest years, prior to its formal funding.
Honest notes and limitations
We'd rather tell you the edges of this than have you find them.
Correlation, not causation. We measure the performance of industries, not the specific deals JobsOhio struck. A lagging industry is not proof the program failed, just as a growing one would not be proof it succeeded — other forces move employment in every sector. What the analysis establishes is whether the industries the program prioritized kept pace, not why.
Selection and maturity. JobsOhio chose industries in which Ohio was, in many cases, already large and established. Large, mature employment bases tend to grow more slowly in percentage terms than small or emerging ones. We hold the program to the industries it named regardless — they are the ones it said it would grow — but a reader should understand that the targets were not a random draw, and that maturity works against high growth rates.
The 2013 baseline understates the early program years. Our window opens in 2013, when JobsOhio became formally funded through the liquor-franchise lease. JobsOhio's own claims reach back to 2010–2011, before that funding existed. Gains the program may have produced in its first years, prior to its formal funding, fall outside our measurement.
Recent investments will not yet show. Major commitments announced in 2022–2023, including the Honda–LG Energy Solution electric-vehicle and battery investments, will not appear in employment data until 2025–2026 and beyond. This is a real limitation, and it cuts in JobsOhio's favor.
Suppression limits coverage. As documented in the funnel, twenty of the 103 named codes cannot be measured end to end, and five cannot be measured at all. We bound the employment this represents and show it is small, but it is not zero.
Reproduce it yourself
If you want to rebuild this benchmark, you need:
- QCEW state-level annual singlefiles for 2013 and 2025, from BLS, for Ohio and every other state.
- The 103 NAICS codes JobsOhio names across its ten target sectors, filtered by own_code = 5 (private) and the appropriate agglvl_code for state-level 6-digit (and 4-digit, where applicable) NAICS reporting.
- The funnel rules in "What we can measure": drop codes with no clean Ohio data in any year, then codes suppressed in 2013 or 2025.
- The three-step calculation in "How the benchmark is calculated," and — for the national view — the size-matching rule in "Size-adjustment."
There is no proprietary data, no model, and no fitted parameters. If you replicate our process and get different numbers, we want to know. Tell us, and we'll look.
Support Data That Serves the Public
Data should empower people, not just institutions. Your support helps us create accessible research, visualizations, and tools that uncover economic inequality and inform better decisions.
Donate
Enjoying this post?
Tell others about it.
More articles like this
Fetching Related Posts
There are no other articles tagged with Visualization