

Healthcare is becoming eldercare
A comparison of the growth by occupation within the Healthcare and social assistance industry over the past two decades

Eric Pachman
Published
June 5th 2026
“Healthcare” is Becoming Eldercare
We talk about healthcare like it's doctors and nurses. It isn't, and it's been drifting further from that picture for twenty years.
Here's the whole sector - every job in Healthcare & Social Assistance, the part of the economy the government files under “NAICS 62” - in 2005 and again in 2025. It added 8.8 million jobs over those two decades, growing 58%. The interesting question isn't how many. It's which ones.
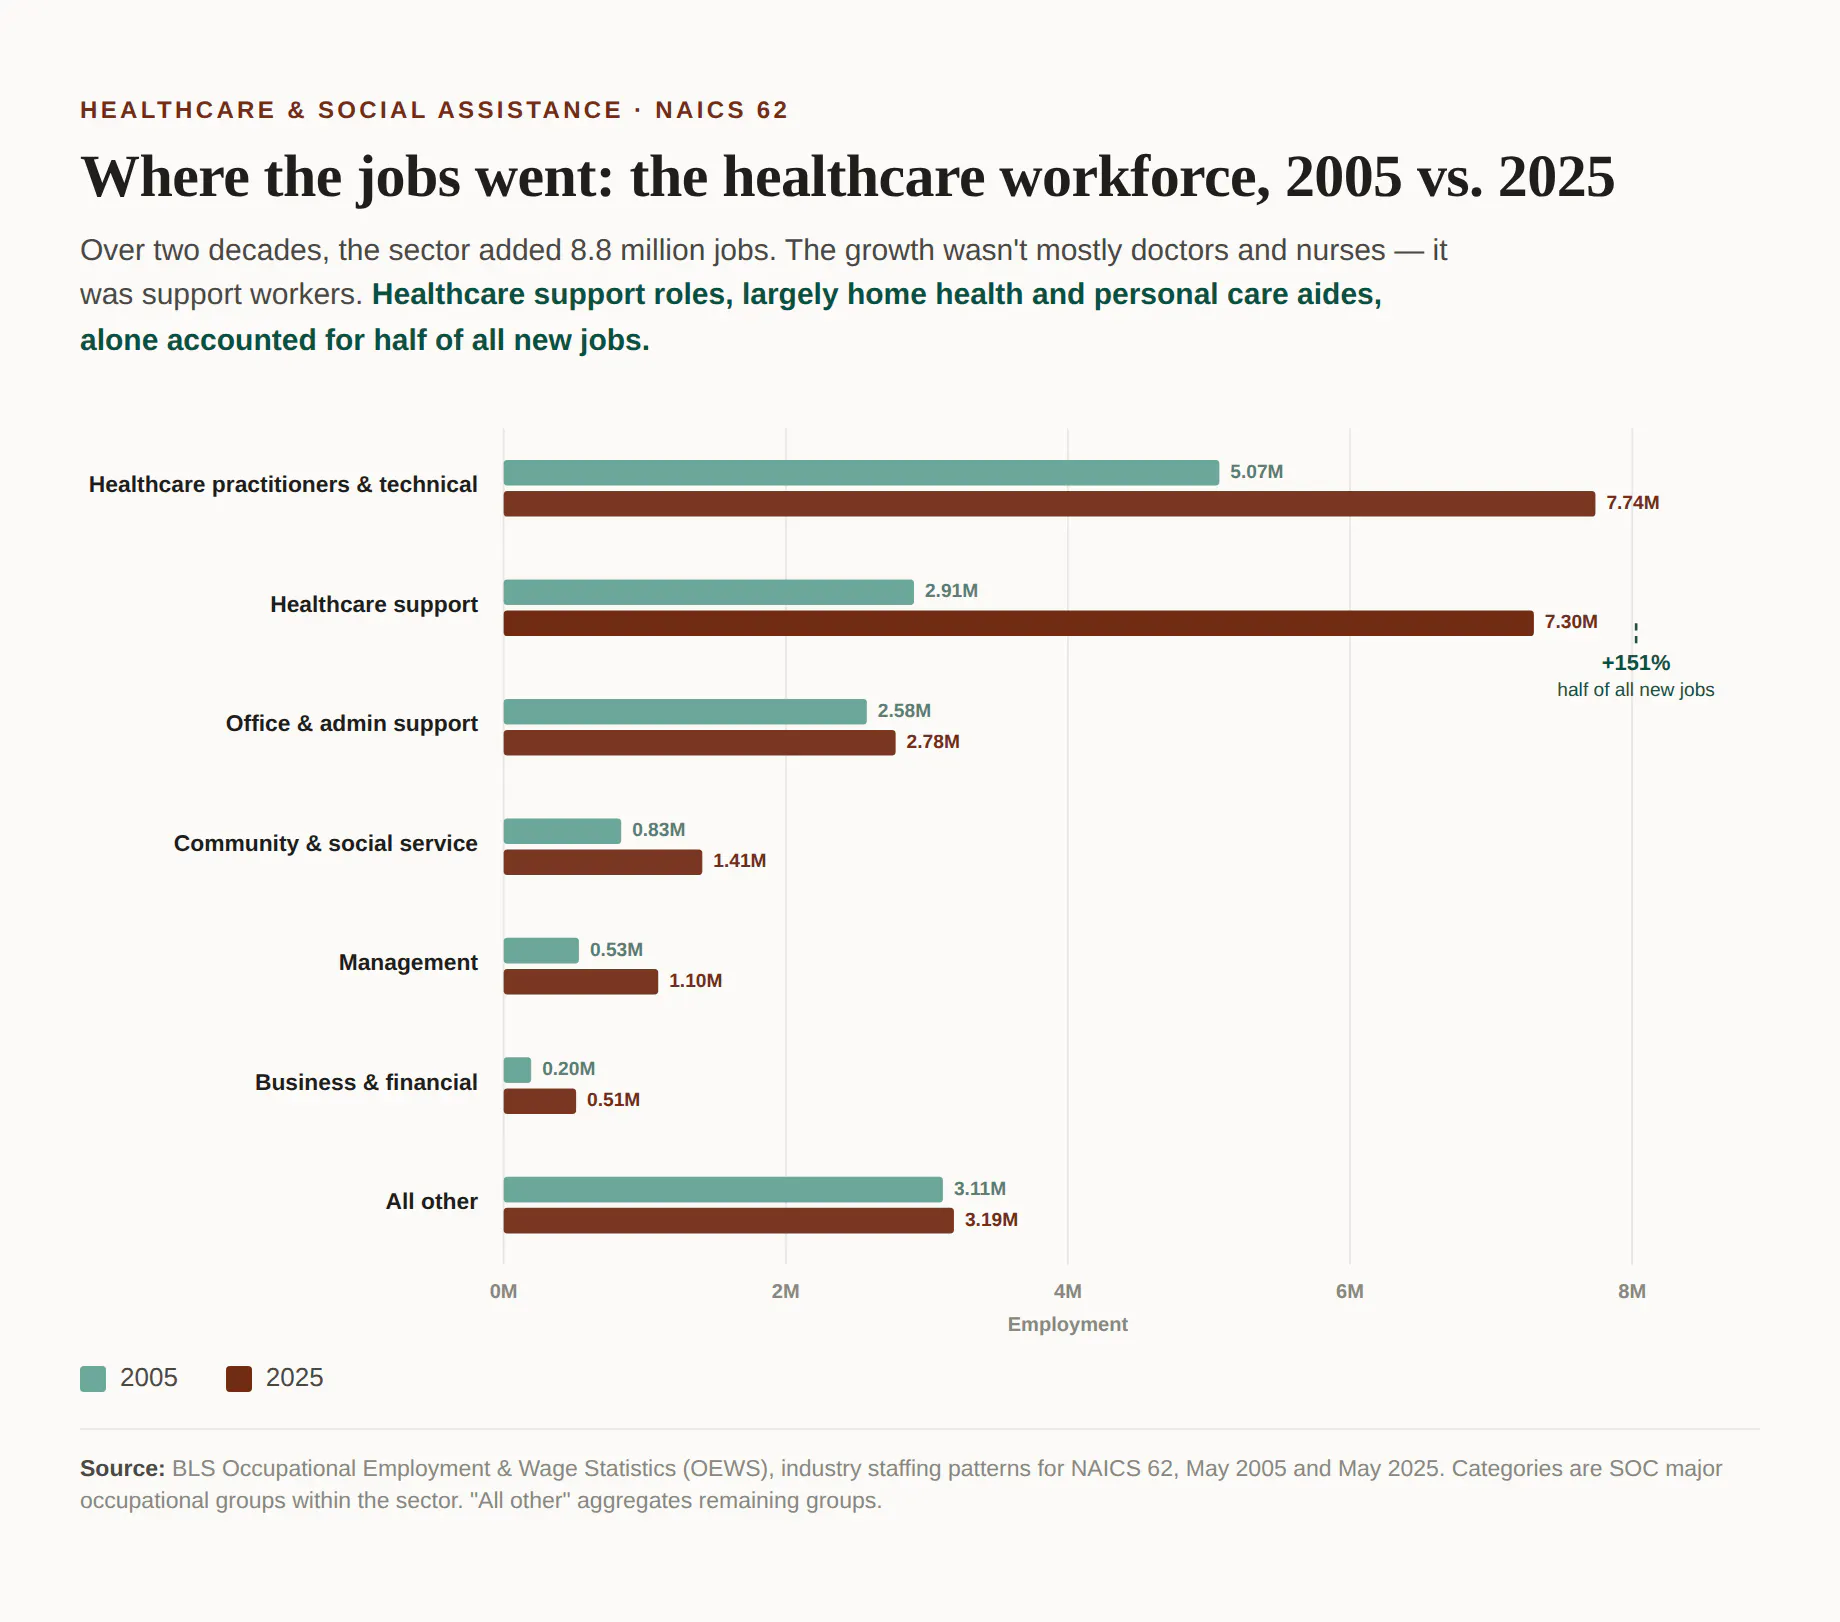
One bar has done most of the heavy lifting over the past two decades.
Healthcare support - the home health aides, personal care aides, and nursing assistants who do the hands-on, lower-credentialed work of caring for people - went from 2.9 million workers to 7.3 million. It grew 151%. It has nearly overtaken practitioners. And it alone accounted for half of every new job the sector created. It's also the lowest-paid corner of the sector: in May 2025, healthcare support workers earned a median of just $38,160 a year.
So if you want the short version: healthcare's primary growth engine wasn't medicine. It was caregiving. The sector is becoming an eldercare sector, and it's the aging of America showing up in the only place it can - in the labor that aging requires.
This much is clear. The rest of the picture - less so.
The bar that lies (a little)
Look at growth rates instead of head-counts and a different group jumps to the front:
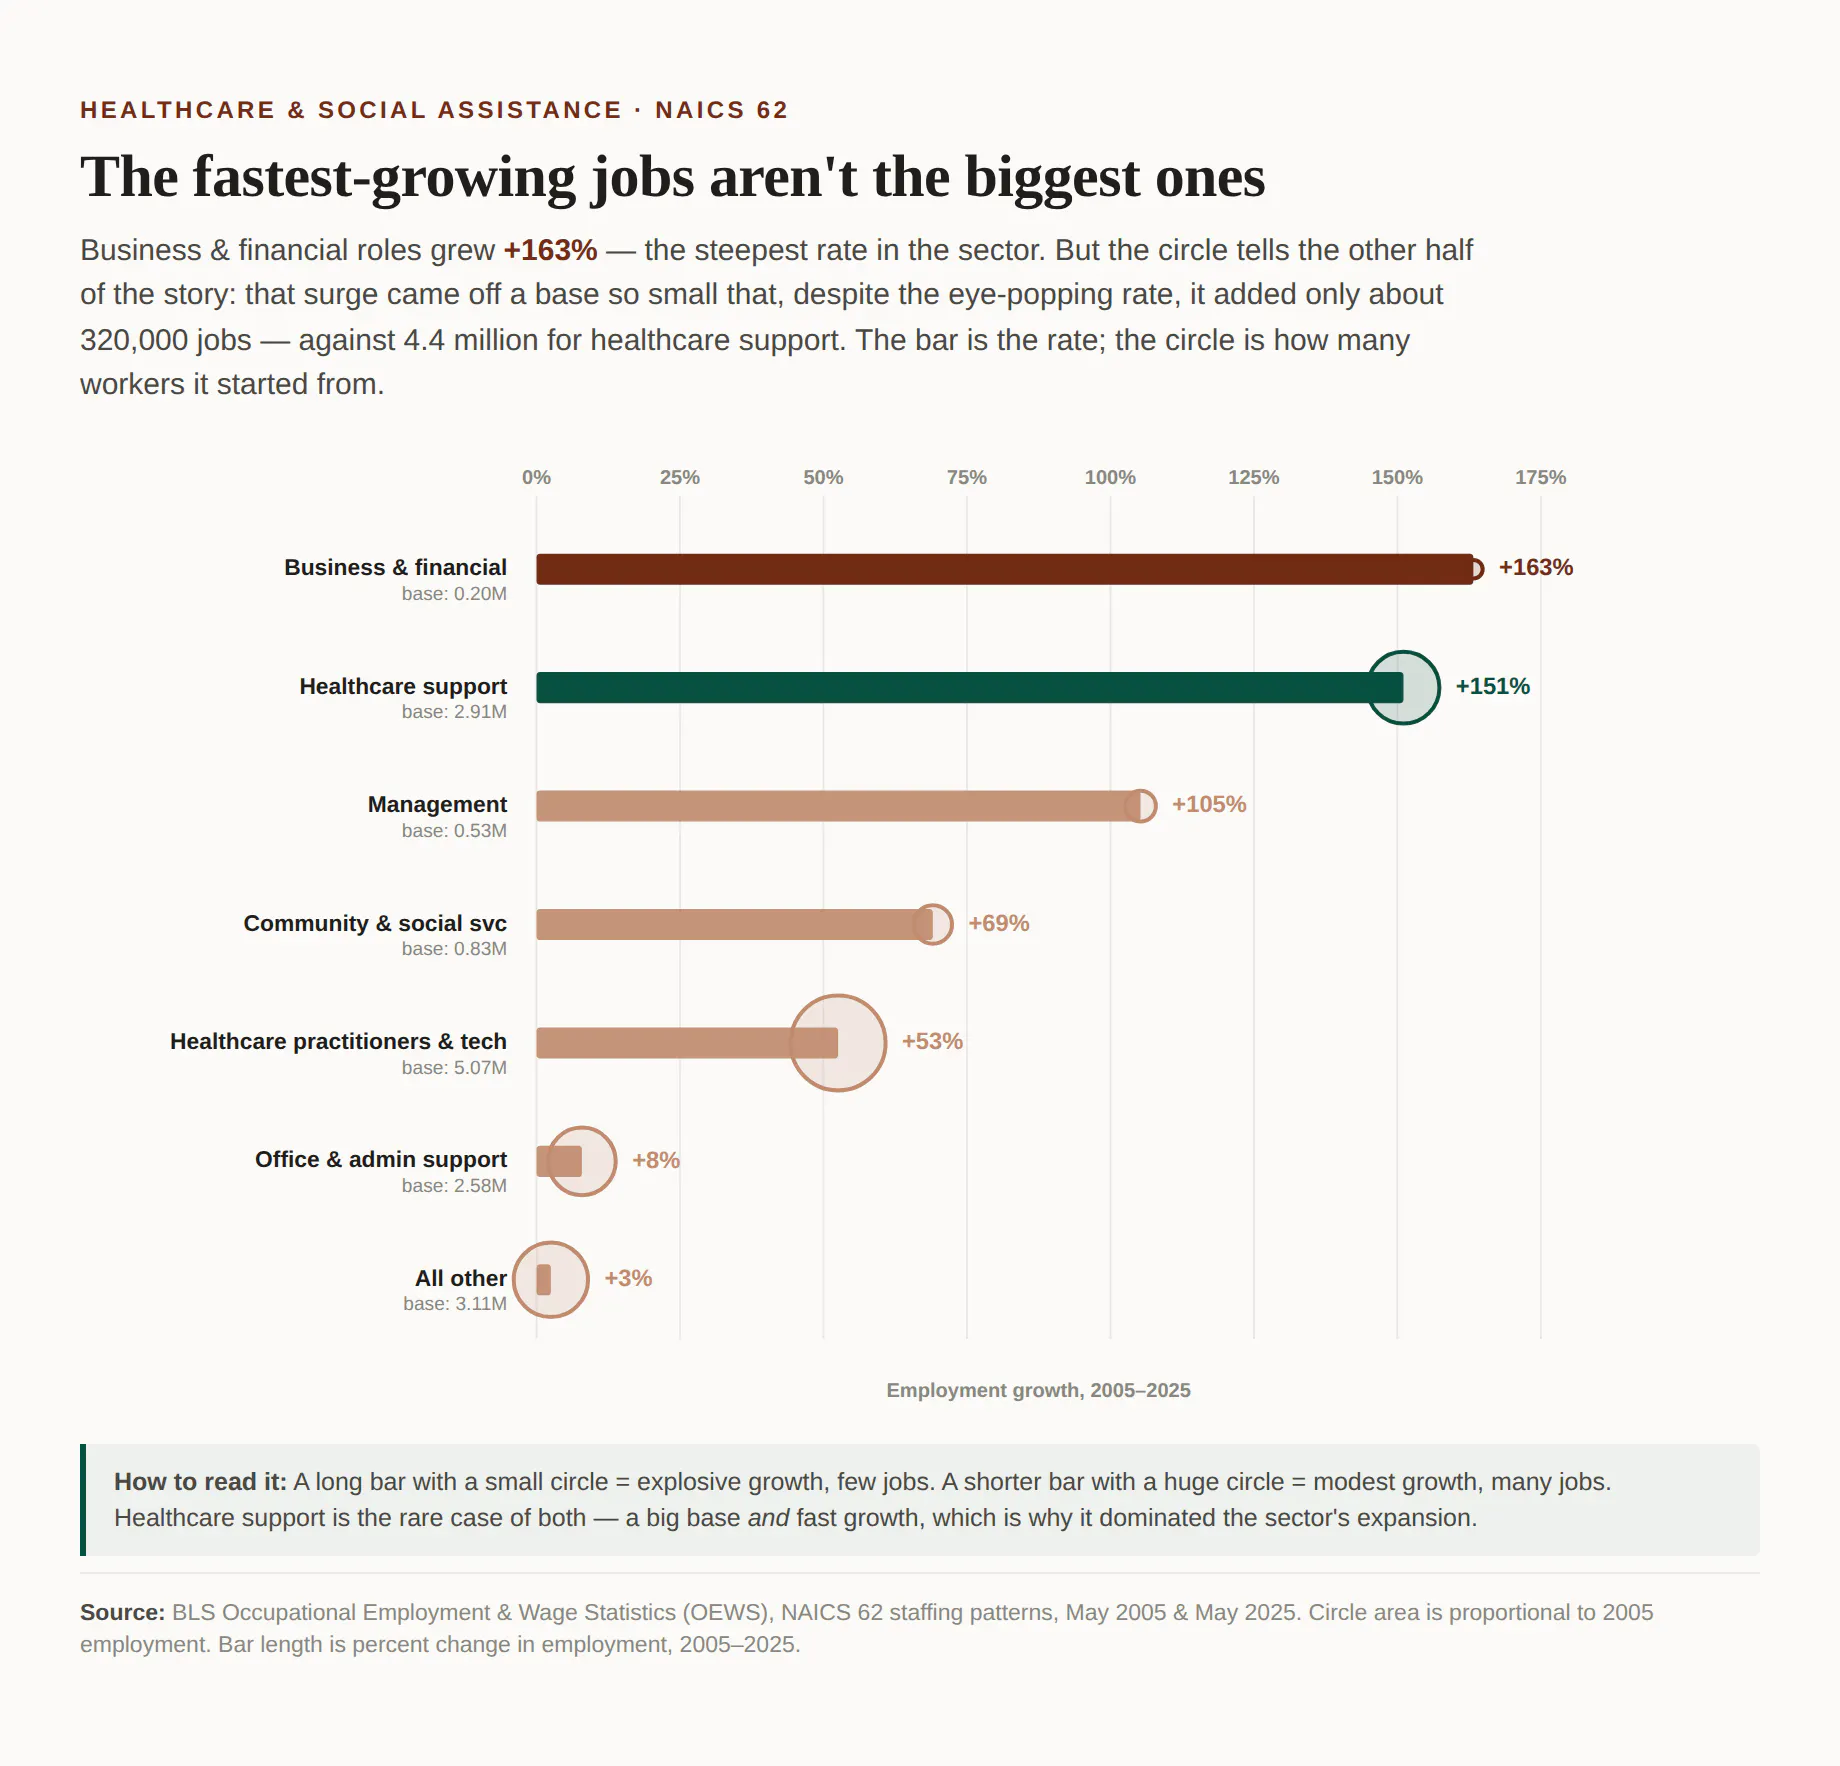
Business & financial roles grew 163% - the fastest in the sector. Faster than support. Faster than anything. If you stopped reading there, you'd write the headline "healthcare is being eaten by financial bureaucracy," and a lot of people have written exactly that.
But the circle is the rest of the story. Business & financial grew 163% off a base so small it's still only 2% of the sector.
That's the whole trick of percentages, and it's worth keeping somewhere you can see it: a big rate off a small base is a small number. Business & financial added about 320,000 jobs. Healthcare support added 4.4 million. Same chart, opposite truths, depending on which axis you read.
What didn't happen
Here's the one that surprised me the most:
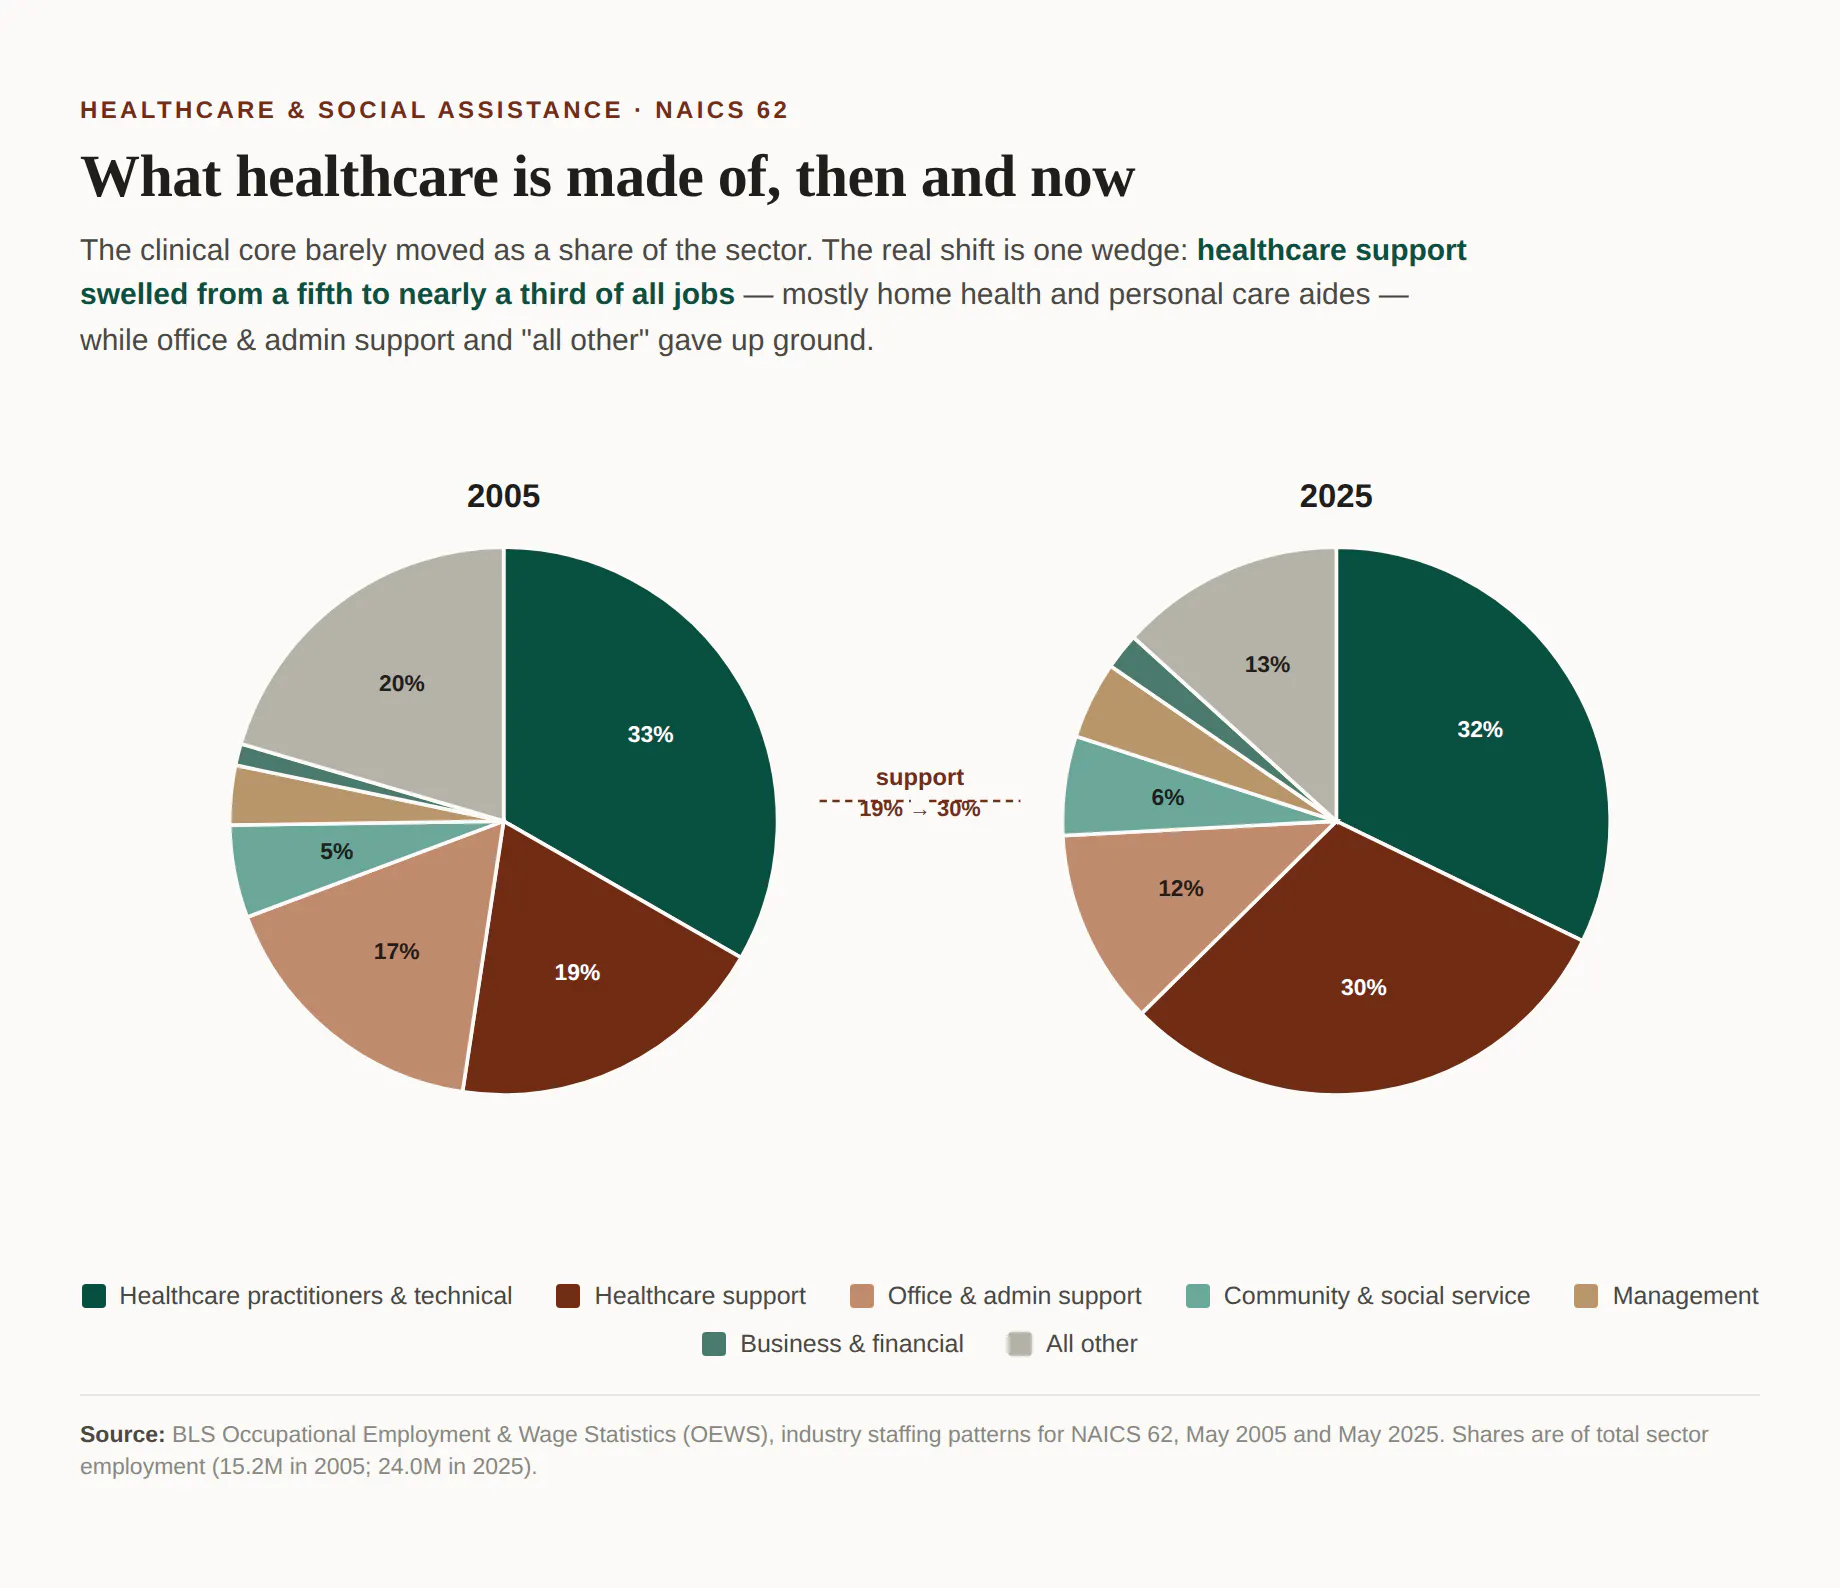
The clinical core - practitioners and technical staff, the doctors-and-nurses bucket - barely moved as a share. About a third in 2005, about a third in 2025. Steady. Makes sense so far.
Until this part:
Office & administrative support - the secretaries, billing clerks, and schedulers - lost share. From 17% of the sector to 12%. In raw numbers it edged up over two decades from 2.58 million to 2.78 million, a rounding error against a sector that added 8.8 million jobs.
Sit with that for a second, because it cuts against the dominant narrative - one so powerful that I just believed it until I worked this data. The story is that healthcare drowned in administrative bloat. But the clerical back office - the people we picture when we complain about healthcare paperwork - barely grew at all, and shrank as a share of healthcare over the exact twenty years we were all complaining about the paperwork. The forms didn't go away. But the people filing them grew far slower than everyone else.
And note what else happened over these two decades. Between 2005 and 2025, the scaffolding of American healthcare was rebuilt: Medicare Part D took effect in 2006, the Affordable Care Act passed in 2010 and phased in through 2014. Whatever else those two decades did, they were not quiet ones for the system.
So what's the story?
Here's what we'll commit to, because the data commits to it:
Social assistance is booming. The growth in American healthcare is the growth of hands-on support care - aides, attendants, the workforce of an aging country. That's not an interpretation. It's the single largest, clearest movement in the numbers, and every chart above says the same thing.
Everything else you've heard - the bureaucracy story, the administrative-bloat story, the doctors-vs-administrators story - gets complicated the moment you put it next to the data. The clerical workforce barely grew. The financial workforce grew fast but stayed tiny. The clinical core held its share of the industry flat. You can build a narrative out of any one of those, and people do. We'd just rather hand you the charts and let you decide which one you believe.
The numbers are the numbers. The story is yours.
Data: Bureau of Labor Statistics, Occupational Employment & Wage Statistics (OEWS), industry staffing patterns for NAICS 62, May 2005 and May 2025. Categories are SOC major occupational groups. Shares are of total sector employment (15.2M in 2005; 24.0M in 2025). Median wage is for healthcare support occupations (SOC 31-0000) within NAICS 62, May 2025.
Support Data That Serves the Public
Data should empower people, not just institutions. Your support helps us create accessible research, visualizations, and tools that uncover economic inequality and inform better decisions.
Donate
Enjoying this post?
Tell others about it.
More articles like this
Fetching Related Posts
There are no other articles tagged with Data 4 Thought