
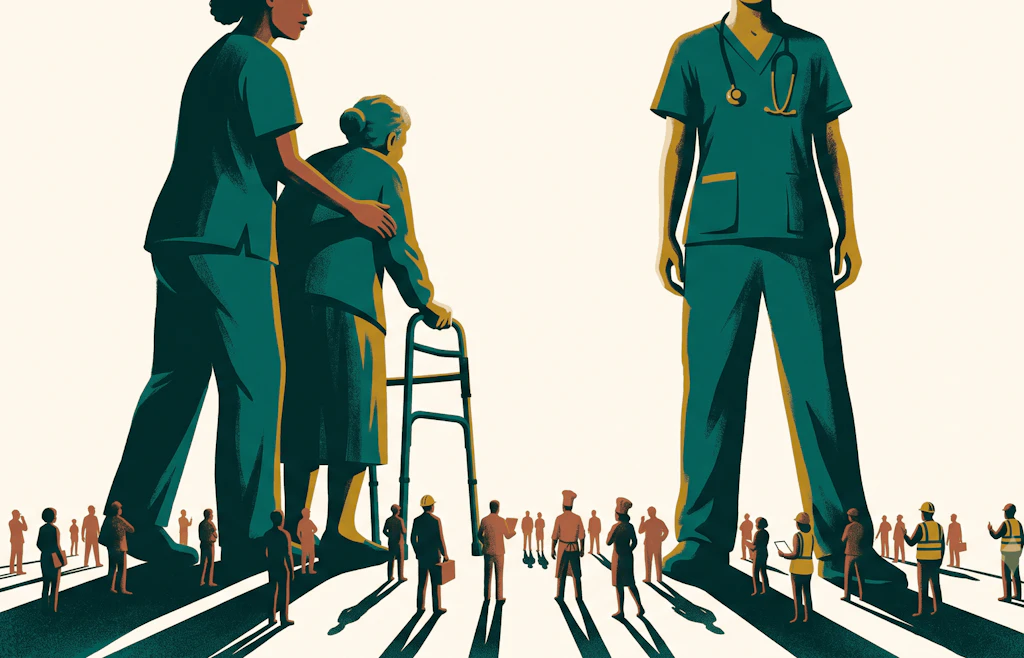
Giants Walk Among Us
9 in 10 new American jobs come from one place

Eric Pachman
Published
July 6th 2026
Giants Walk Among Us
Last week, the Bureau of Labor Statistics released its monthly nonfarm payroll data. That is just a fancy way of saying: how many payroll jobs did America add last month? (Note that this count does not include gig work.)
This post is not a news update telling you what the latest number was. You can get that from Google or any number of news outlets.
Instead, this post is yet another attempt to show you one of the most concerning issues in America's job market: its overreliance on health care.
You may be thinking: you have said this time and again. Guilty as charged. But until everyone knows this is a problem we must address, we will keep showing it to you in new ways. Our goal is for the unbalanced nature of the U.S. job market to become as well known as the details of Taylor Swift and Travis Kelce's wedding. When we get there, we will finally let this rest.
So here is a brand-new view of the payroll data.
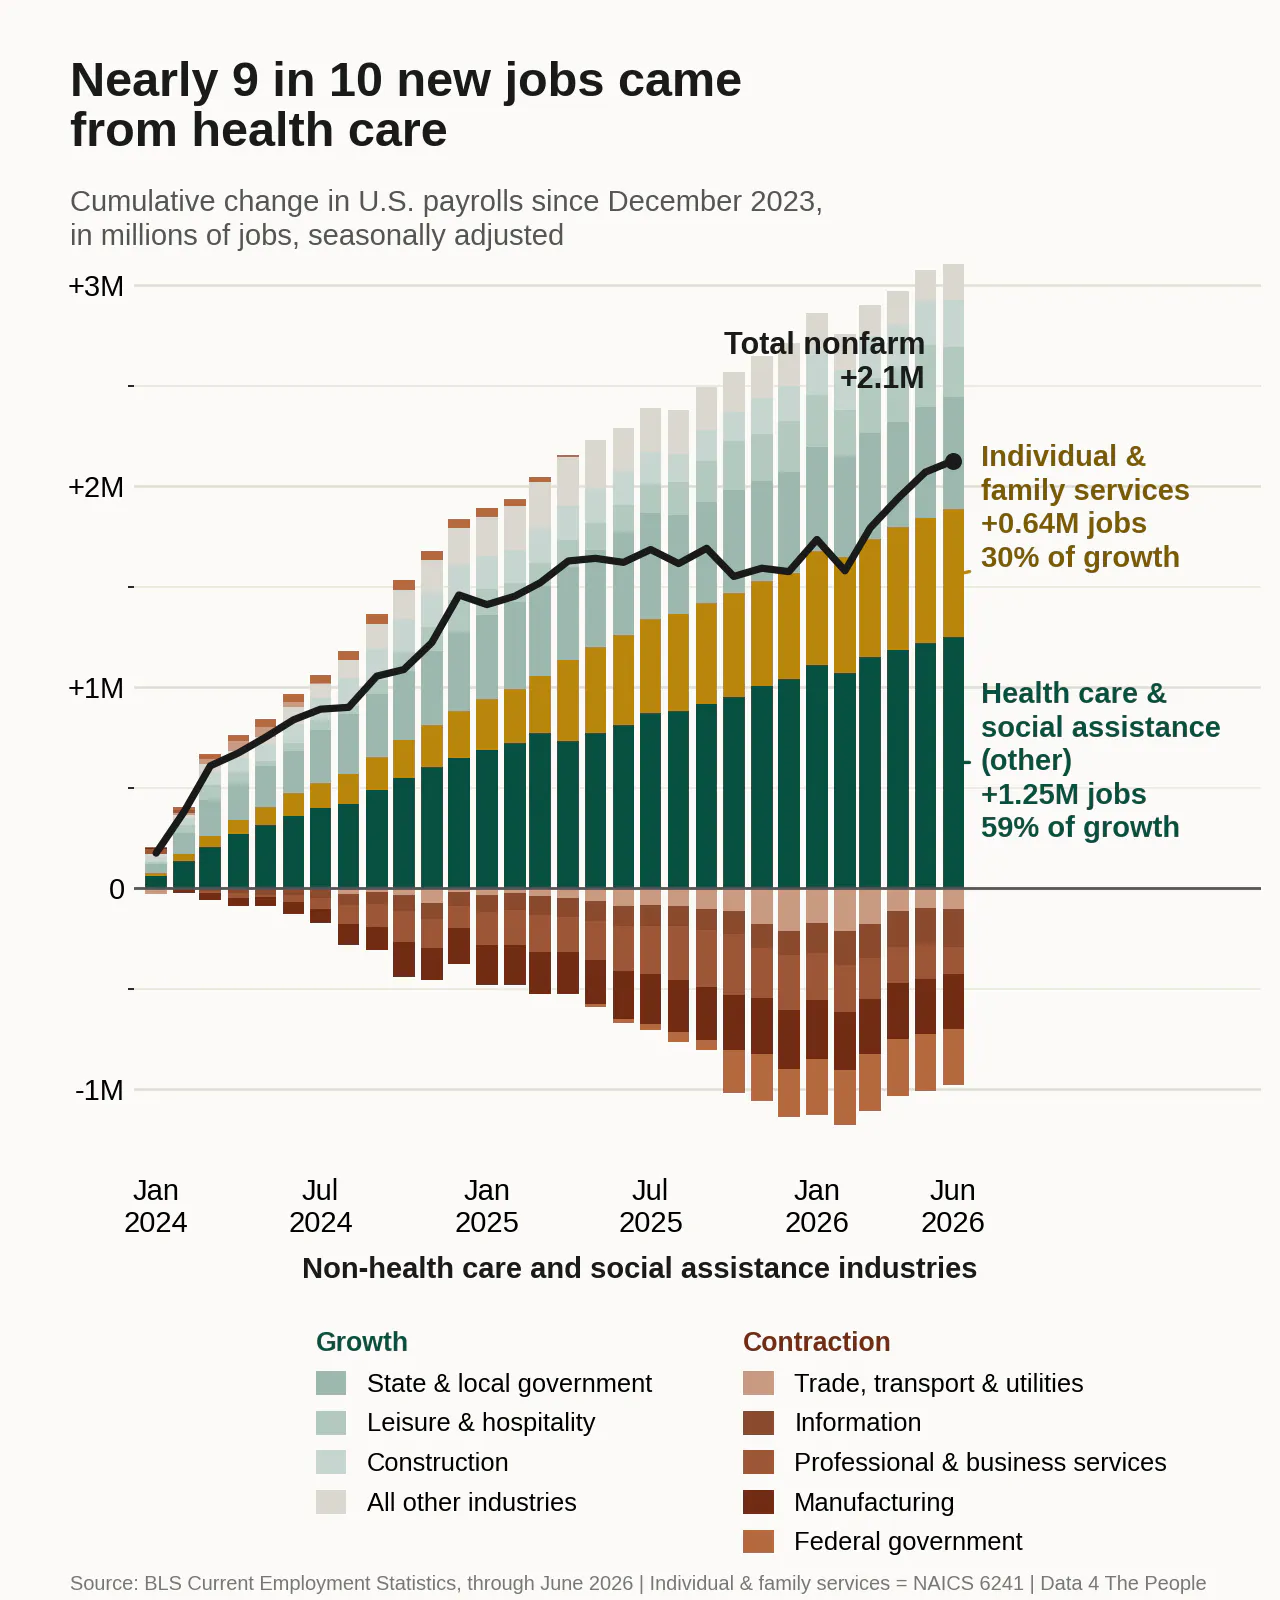
The chart shows cumulative job gains since the start of 2024. Overall, the U.S. has added 2.1 million jobs through June 2026 (the black line). Roughly 89% of those jobs came from a single sector: health care and social assistance.
But if you have been reading our work, you know that health care and social assistance is increasingly becoming care for the elderly and disabled. So we separated out one industry, Individual and Family Services, from the rest of health care and social assistance. The answer: 30% of all new jobs in America came from this one industry.
Let us put that in context. Back in January 1990, this entire industry had just 415,000 jobs. That was 0.38% of all payroll jobs in the country. Today it employs 3.8 million workers, or 2.4% of all jobs. Sit with that for a second. Nearly a third of all recent job growth came from an industry that even now makes up just 2.4% of our workforce. A giant grew up right under our noses.
Now it should make sense why we spent months building our state-by-state analysis of what we call the Medicaid Care Economy. Medicaid is the primary funder of these caretaking jobs, and federal Medicaid spending is now scheduled to shrink by roughly $1 trillion over the next decade, about a tenth of the program. The biggest provisions, including work requirements and six-month eligibility checks, switch on in January 2027. We are bracing ourselves for what happens to these jobs when that funding starts to recede.
And now there is a second squeeze on this same workforce. On June 25, the Supreme Court ruled 6 to 3 that courts cannot review the administration's decision to end Temporary Protected Status for roughly 330,000 Haitians and several thousand Syrians, clearing the way for those protections, and the work permits that come with them, to end. Here is why that matters for this story: these workers are disproportionately concentrated in caretaking. The Boston Globe reported, citing National Domestic Workers Alliance data, that about 13,000 Haitian TPS holders work as nursing assistants, caring for roughly 65,000 patients every day, and immigrants overall make up nearly 30% of the direct care workforce in long-term care settings like nursing homes and home care. We cannot yet see this shock in the payroll data, and we will not pretend to predict its size. But an industry that supplied 30% of America's job growth may soon lose a meaningful slice of its workers and a slice of its funding at the same time. That is a lot of weight resting on one giant's shoulders.
There is one more thing to consider. Go back to the chart and notice that the industries that lagged for two years, the ones in contraction, look like they are staging a bit of a comeback since February 2026. Before you get too excited, you should first understand how the payroll numbers get made, and what happens once a year when the model behind them meets reality.
The monthly jobs number is built from a survey of about 119,000 employers, plus a statistical model that guesses how many jobs were created by brand-new businesses and lost at closing ones. The BLS calls it the birth-death model. It is a reasonable tool, but it has a known flaw: it cannot see turning points. When the economy slows, the model keeps adding jobs that no longer exist.
Once a year, the BLS checks the survey against reality. Nearly every employer in America files quarterly unemployment insurance tax records covering about 97% of payroll jobs. This count is called the QCEW, and each February the BLS re-anchors, or benchmarks, the survey data to it. Think of it as the annual audit of the jobs report.
Here is what the last four audits found:
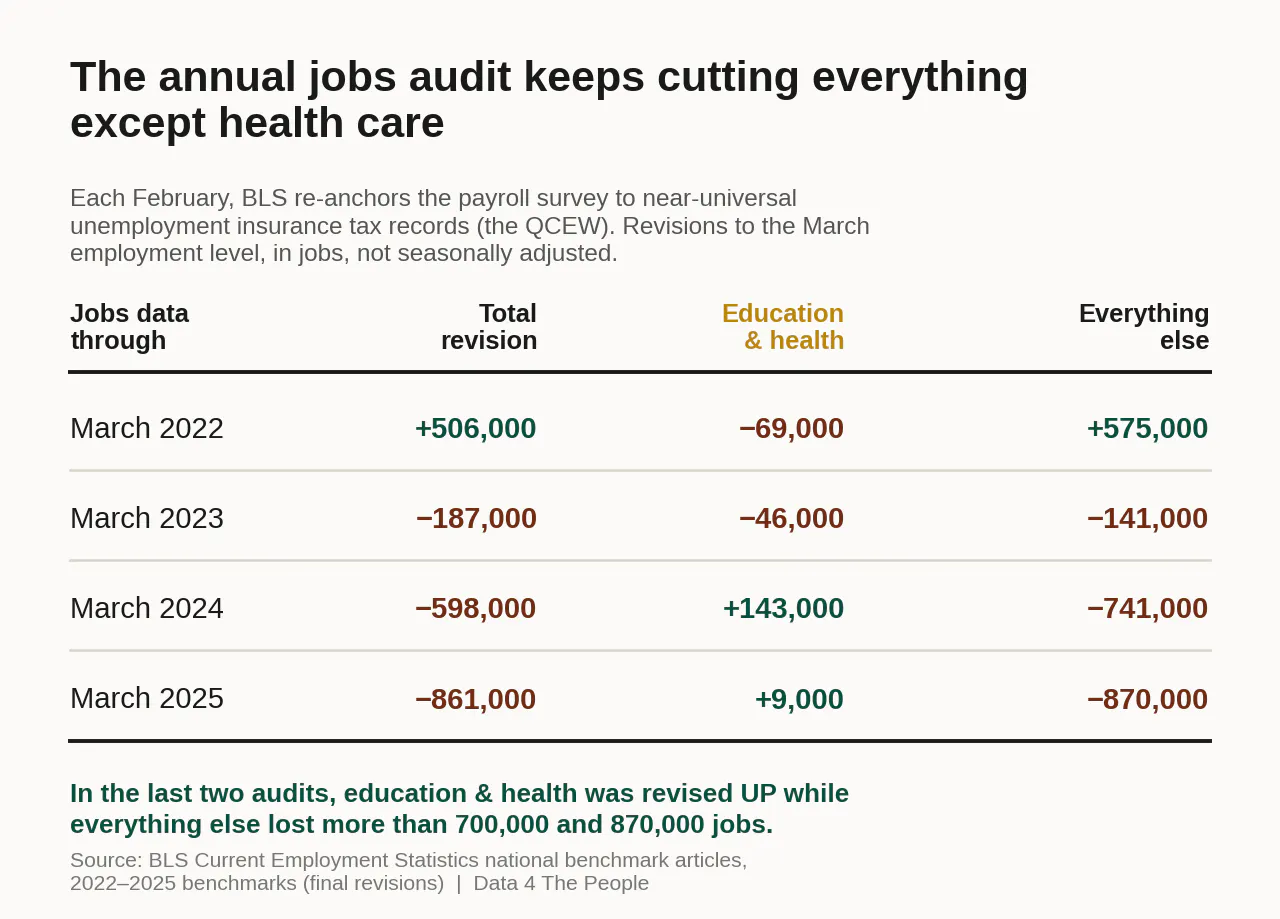
Three straight years of downward revisions, each bigger than the last. The most recent audit, published this February, erased 861,000 jobs, the largest downward benchmark revision on record. For the year ending March 2025, monthly job growth turned out to be roughly half of what was originally reported.
But look closely at the split, because it is the most important part of this table. The audits did not take away health care jobs. In each of the last two benchmarks, education and health services was revised up while everything else was revised down by more than 700,000 and 870,000 jobs. The phantom jobs were in leisure and hospitality, trade, manufacturing, professional services. The caretaking jobs were real, and then some.
So when you look at that recent non-health "comeback" on our chart, remember two things. First, every data point after March 2025 has not yet been audited. Second, the industries doing the bouncing are the exact industries the audit keeps cutting. We are not saying the comeback is fake. We are saying the last three audits give us every reason to wait for the receipts. The next preliminary audit lands August 28, 2026. We will be reading it so you do not have to.
Which brings us back to where we started. Even if every un-audited data point turns out to be exactly right, the picture is stark. Nearly nine in ten new American jobs come from health care and social assistance. And if the last three audits are any guide, that ratio only grows once the QCEW reality catches up. Three in ten come from a single caretaking industry that barely registered a generation ago. That industry is funded primarily by a program facing a trillion dollars in cuts starting in January, and staffed in meaningful part by workers whose legal status is now in question.
We are not rooting for any of this to go badly. We would love to write the post where manufacturing and construction carry the recovery and the audit revises the numbers up. But hope is not a data source. Accountability means looking at what the records actually show, and the records show an economy carried by giants into a year when those giants take two hits at once. We will keep watching the data. We hope you will keep reading it with us.
Support Data That Serves the Public
Data should empower people, not just institutions. Your support helps us create accessible research, visualizations, and tools that uncover economic inequality and inform better decisions.
Donate
Enjoying this post?
Tell others about it.
More articles like this
Fetching Related Posts
There are no other articles tagged with Data 4 Thought