

Frozen in 1963: How America's Poverty Formula Fails the People It Was Built to Protect
A 60-year-old formula. A vanishing housing supply. And a government too comfortable to fix either.

Eric Pachman
Published
May 26th 2026
Frozen in 1963
The year was 1963. You listened to music on a vinyl record player - the #1 song on the Billboard year-end chart was "Surfin' U.S.A." by The Beach Boys. On Friday nights, nearly 40% of American households tuned in to The Beverly Hillbillies. At the movies, Cleopatra was the year's biggest box office hit, though its staggering production costs nearly bankrupted 20th Century Fox. And a Philips engineer named Lou Ottens unveiled a small plastic contraption called the compact cassette tape - a revolutionary idea that music could be portable.
It was also the year that a Social Security economist named Mollie Orshansky developed a formula for measuring poverty in America - one that multiplied the cost of a basic food basket by three.
Now imagine nothing fundamentally changed from 1963. No computers. No internet. No Michael Jackson. No Beyoncé. No smartphones. No AI. Just marginal “improvement” at roughly 3% a year.
This isn't sci-fi. For 80–90 million Americans, this is reality - because Orshansky's formula became the framework for the Federal Poverty Level (FPL), and it hasn't fundamentally changed since. It's just been grossed up with inflation, year after year, decade after decade.
This wouldn't matter if the FPL were just an academic exercise. It isn't. The table below shows the federal assistance programs that determine eligibility based on this CPI-adjusted, 1960s-era formula - programs that between them touch the lives of roughly one in four Americans.
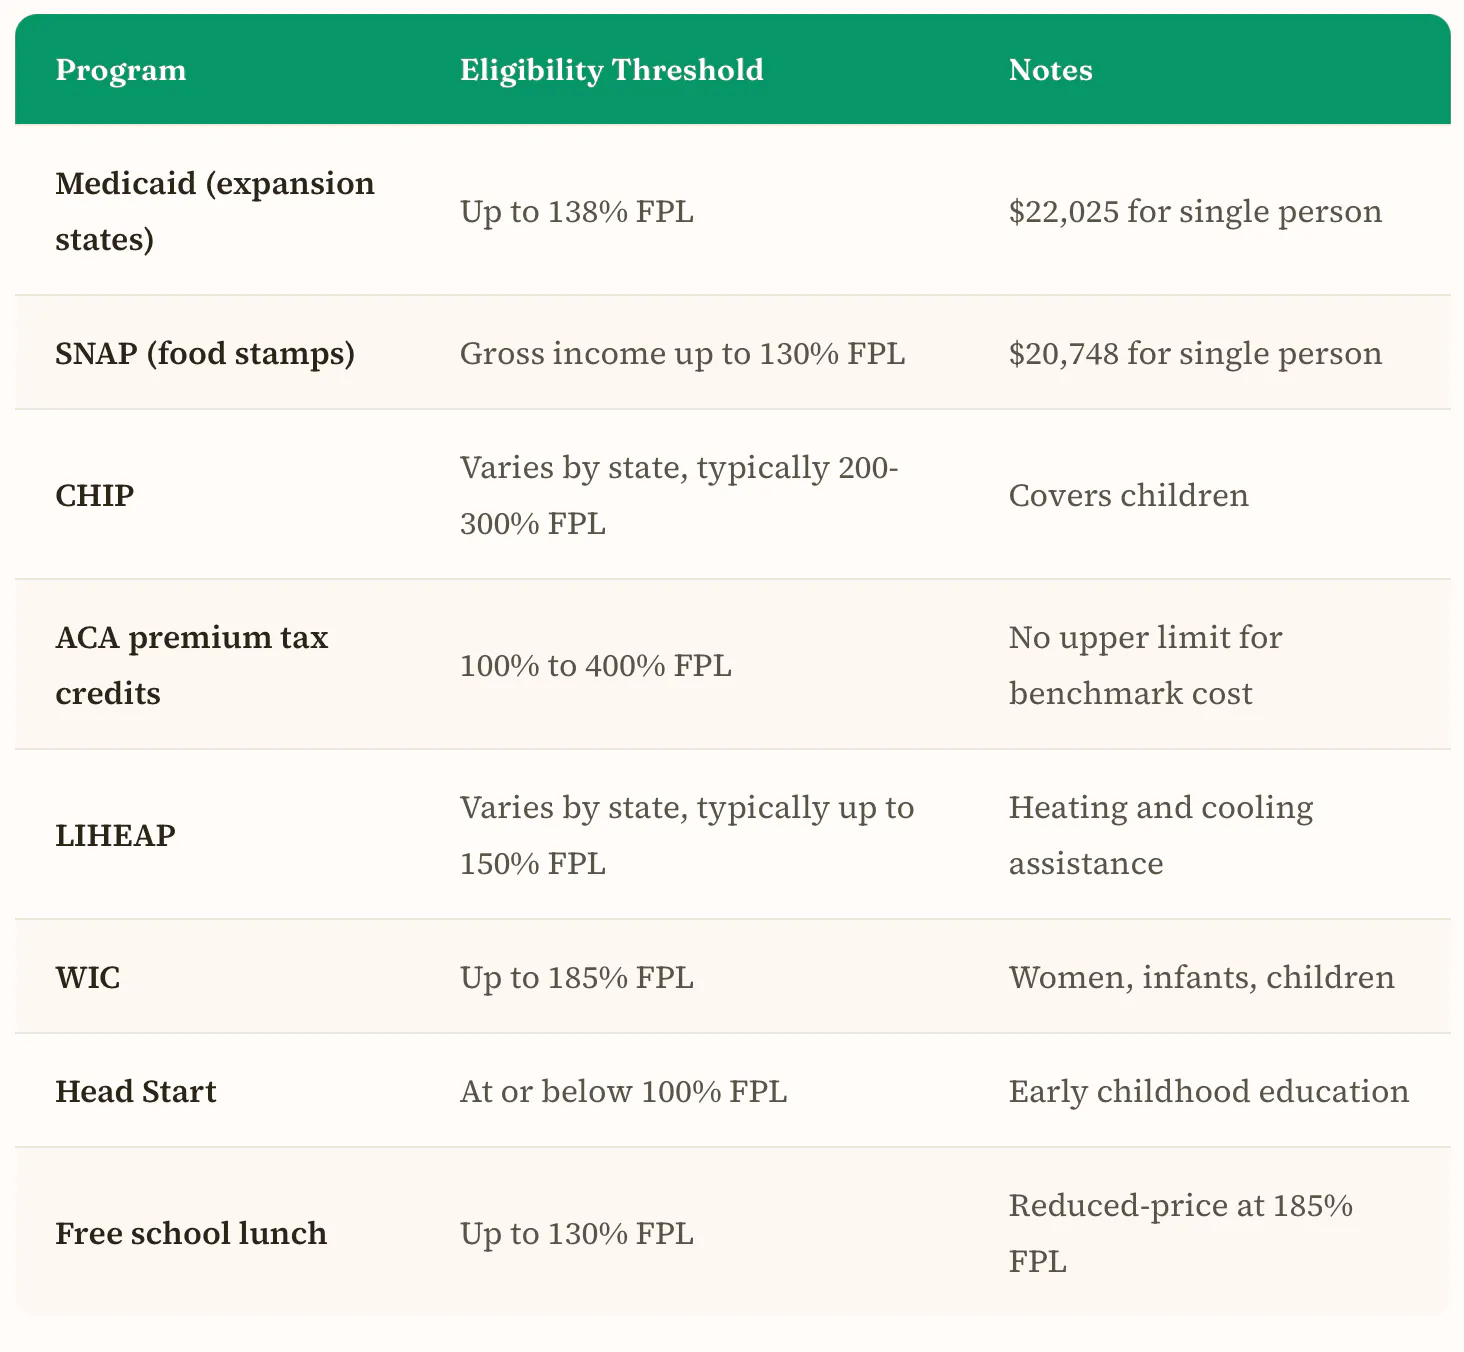
Source: benefitsusa.org
The FPL is not a neutral measurement. It is a gatekeeper. And the gate hasn't been updated in sixty years.
So how stale is it? If Orshansky's food × 3 assumption still held today - if food, shelter, healthcare and everything else had risen at roughly the same rate since 1963 - the two lines in the chart below would be right on top of each other. The FPL would be rising in lockstep with what low-income families actually pay for rent.
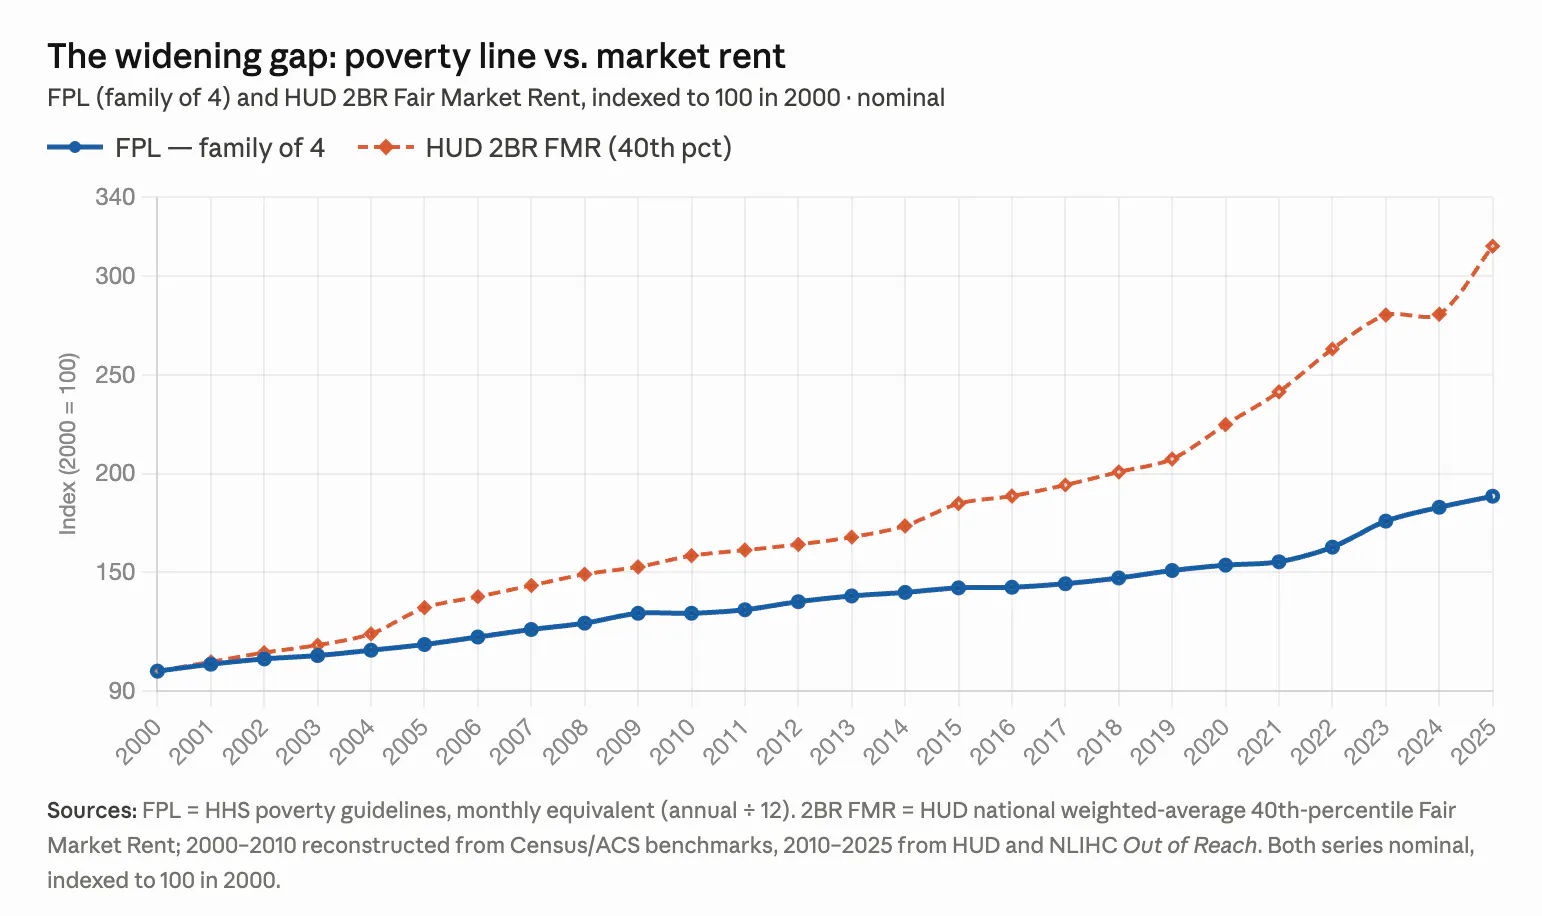
Not even close. Since 2000, the FPL is up 89%. Low-income rent is up 215%. The gap isn't a rounding error. It's a policy choice - because our government has had the data, has had better methodologies available, and has chosen, year after year, not to act. All it would take is updating a spreadsheet. Apparently, that's too much to ask.
Much easier to grab a TV dinner, plop down in front of a 17" black-and-white television, and catch the latest episode of The Beverly Hillbillies.
It gets worse.
Here's where the broken formula meets the broken market. The 2026 FPL for a family of four is $33,000 per year. Apply the standard rule of thumb - that a household should spend no more than one-third of its income on housing - and that family can afford $917 per month in rent. Simple math.
But we don't live in a back-of-the-envelope world.
That family doesn't just need a number. They need to go find an actual unit - four walls and a roof - for $917 a month or less. And here's what the market has been quietly doing to that possibility while Washington looked the other way: eliminating affordable units. We've lost 7.6 million affordable units between 2013 and 2023. Not because of a natural disaster. Not because of war. Because the market had no financial incentive to preserve them - and every incentive to replace them with something more profitable.
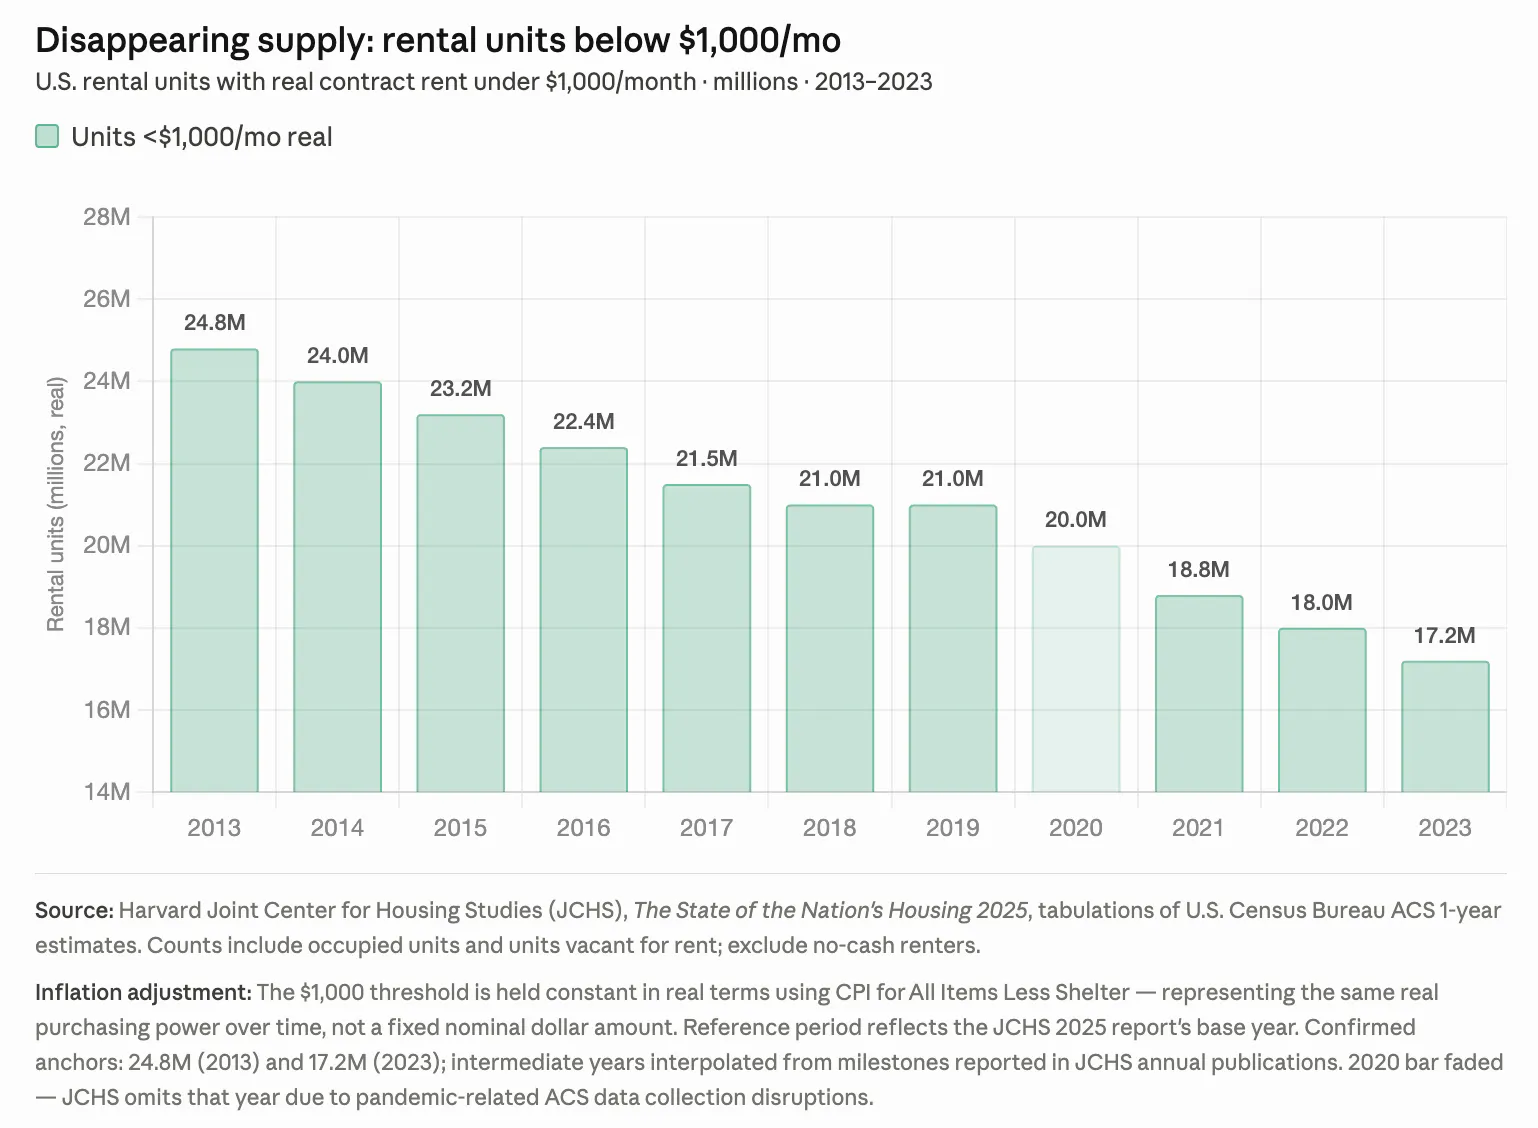
Over that same decade, the overall rental stock grew by 3.3 million units - virtually all of it luxury and market-rate apartments with granite countertops, rooftop pools, and fitness centers, built for renters who could pay. The family at $33,000 a year wasn't the customer. They never were.
So here's where we are. Our government is using a 60-year-old formula - one calibrated to a world where families spent a third of their income on food - to determine who gets help and who doesn't. That formula fails to account for the disproportionate rise in shelter and healthcare. It fails the people it was designed to protect. And those people are left competing for affordable units that the market has been systematically eliminating for a decade, with no sign of stopping.
This is not an accident. It is the compounded result of institutional neglect, outdated policy, and a housing market that was never asked to serve the people who needed it most.
What can you do? More than you think. Call your congressional representative and ask them - specifically - why the federal government continues to use the official poverty measure instead of the Census Bureau's Supplemental Poverty Measure, which already exists, is updated annually, and accounts for actual modern costs. Support local zoning reform that allows affordable housing to be built in your community. And if nothing else, talk about this - loudly and specifically - because the single most effective tool the status quo has is the assumption that no one is paying attention.
The cassette tape Ottens invented in 1963 has been invented, disrupted, and rendered obsolete several times over. The poverty formula from that same year has not changed once.
We can do better. We just have to decide to.
Support Data That Serves the Public
Data should empower people, not just institutions. Your support helps us create accessible research, visualizations, and tools that uncover economic inequality and inform better decisions.
Donate
Enjoying this post?
Tell others about it.
More articles like this
Fetching Related Posts
There are no other articles tagged with Data 4 Thought