
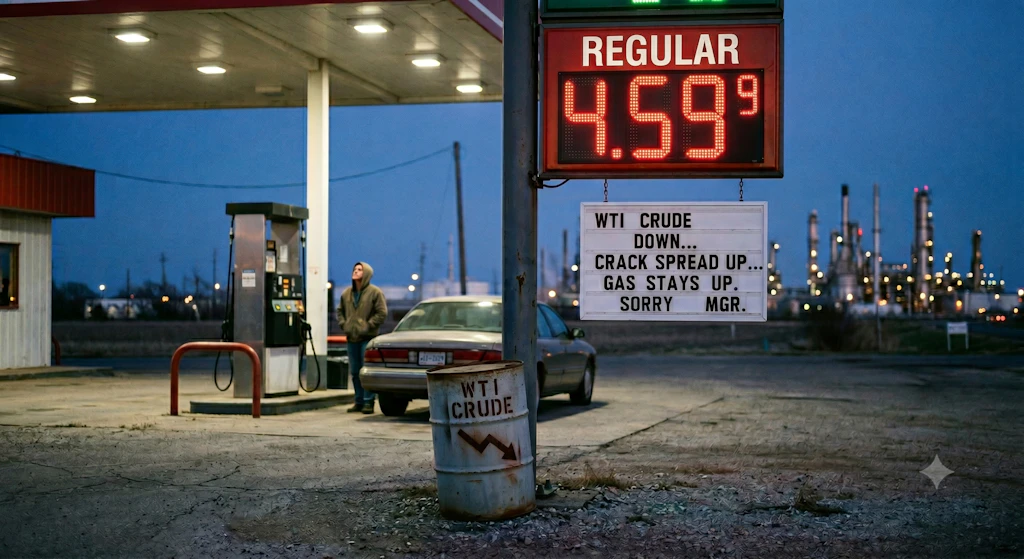
Even if oil falls, your gas might not. Here's why.
There's a number sitting between the price of oil and your pump price. Right now it's stretched to a 40-year extreme.

If oil gets cheaper, will your gas get cheaper too?
It's the obvious assumption. Oil falls, gas falls. And this week, with the market betting on a deal to end the war (a deal that's been "largely negotiated" for two weeks now), that's exactly what everyone expects: crude comes down, relief shows up at the pump. Easy. Clean. That works, except when it doesn't.
Here's why it doesn't. There's a number sitting between the price of oil and the price of your gasoline, and most people have never heard of it. When it behaves normally, cheaper oil does mean cheaper gas. When it doesn't, oil can fall and your pump price can sit right where it is, or even climb.
It's called the crack spread, and it's simpler than it sounds. A hypothetical, overly simplified refinery buys crude and sells just two products: gasoline and diesel. The crack spread is the gap between the two, the refining margin. And to be clear, refiners don't set that gap any more than they set the price of oil. The market does. They take what it gives them. When that gap is normal, your pump price tracks the price of oil, the thing everyone watches. When the gap blows out, fuel detaches from crude and the savings get eaten before they ever reach you. Cheaper oil, same gas.
Right now, that gap is near the widest it's been in forty years. Why? Because of a significant mismatch in the system. It’s true that the U.S. produces a lot of oil, but it’s mostly "light and sweet." Sadly, most U.S. refineries were custom-built decades ago to process "heavy and sour" oil from countries like Canada or Mexico. That’s why we export our own crude and import oil from abroad. This structural bottleneck means domestic refineries can't just easily ramp up gasoline production, no matter how much domestic oil is sitting around. Because global demand for finished fuel remains high while the capacity to refine it is constrained, market forces can drive the price of gasoline and diesel up even as crude oil falls. The widening crack spread is simply the market reflecting this imbalance. Our gasoline price dilemma isn't a simple narrative - it’s a story of structural traffic jams, which is why we devoted the last three days to this crash course in oil economics.
So here's the thing to watch. If a deal gets signed and crude declines, the headlines will say relief is coming. But if the crack spread is now “higher for longer” because of this pesky oil/refinery mismatch problem we have, that relief may not reach your tank. It's the quiet mechanism that can turn a "good news" oil story into no change at all at the corner of your commute.
As with Tuesday's inventory charts, I'm not going to tell you what to conclude. Instead, I'm going to hand you the instrument and let you watch it yourself.
This tracks the 3-2-1 crack spread, the standard industry measure, back to 1986. And here's the small thing we built, in the same spirit as yesterday.
Like Tuesday's inventory data, none of this is secret. The crack spread is quoted daily across the industry. But try to find a chart of it going back decades, free, in the public domain, and you'll come up empty. The data exists, scattered across separate public price series, but nobody has stitched it into one long picture you can actually look at. The free charts show you the last few years. The deep history sits behind expensive terminals most people will never touch.
So we built it. We pulled the public price series, did the arithmetic the industry does, and assembled the one thing that was missing: the whole forty-year view, in one place, free, for you. Yesterday's lesson was that a new angle can turn old data into a story. Today's is its cousin: sometimes the data is public, but the full picture still isn't, and the useful thing to do is simply to go assemble it.
So watch where the line sits now. Then watch what it does if a deal gets announced and crude falls. If oil drops and the line holds, you're seeing exactly what I described, the gap refusing to close, and you'll understand why your gas bill isn't moving as much as we have been led to believe it would.
That's been the whole point this week. Three days, three angles on the same story: how much oil we have, how that's changed, and the hidden number that decides what you actually pay. Not one piece of it was hidden. We just did the work to put it where you could see it.
Now you can watch it yourself, in real time, alongside the rest of us. That's the idea, not to hand you a verdict, but to hand you the instruments and trust you to read them.
Support Data That Serves the Public
Data should empower people, not just institutions. Your support helps us create accessible research, visualizations, and tools that uncover economic inequality and inform better decisions.
Donate
Enjoying this post?
Tell others about it.
More articles like this
Fetching Related Posts
There are no other articles tagged with Data 4 Thought