
Twenty years drive two Americas further apart
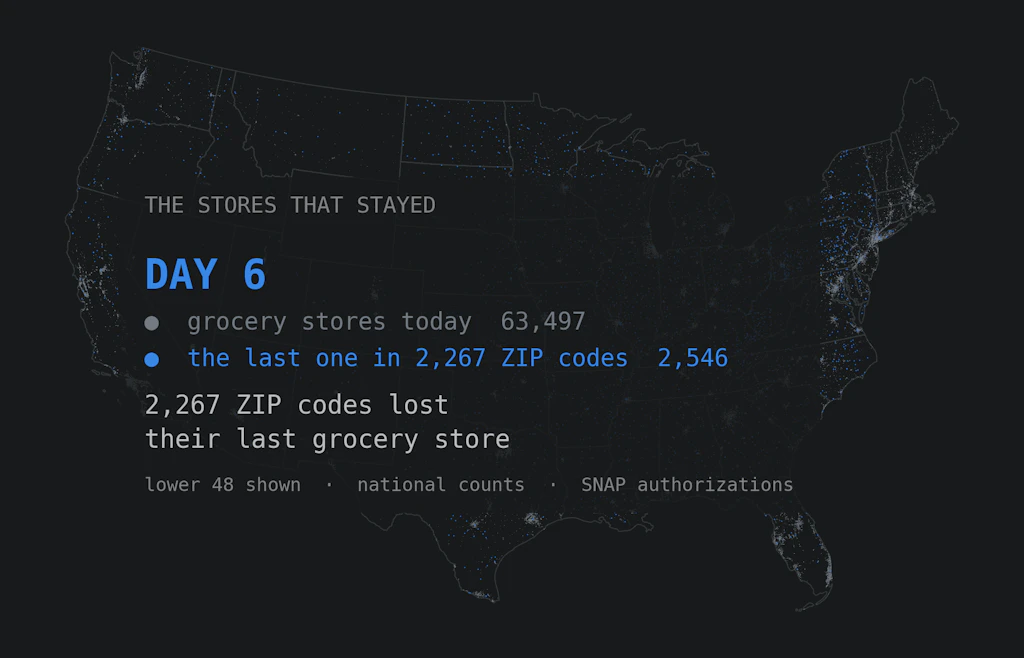
Grocery and pharmacy were more than half the food retail in these places. They are under a third now — and the towns that lost a grocery store have a median population of 1,955.

Eric Pachman
Published
August 27th 2026
SNAP-authorized retailers, 2006–2025, with 2020 census population by ZCTA. The last chapter; an epilogue follows.
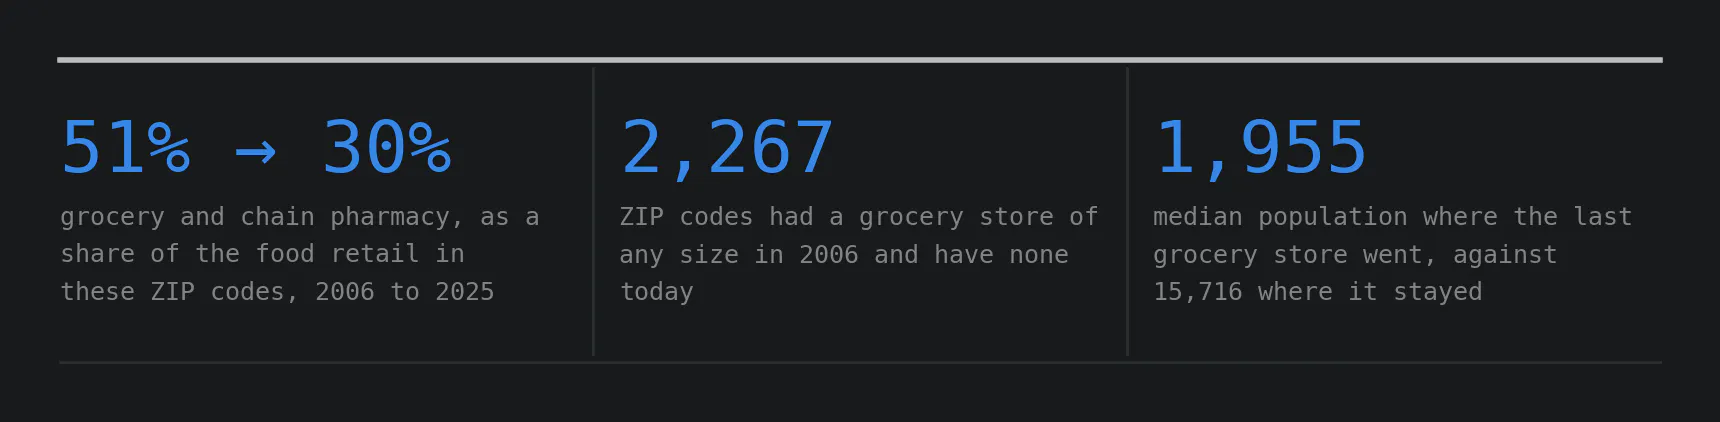
51% → 30% grocery and chain pharmacy, as a share of the food retail in these ZIP codes, 2006 to 2025. 2,267 ZIP codes had a grocery store of any size in 2006 and have none today. 1,955 median population where the last grocery store went, against 15,716 where it stayed.
We are nearing the end of our coverage of the history of retail SNAP authorizations. Today is the penultimate chapter — the one where everything comes together — before tomorrow's closing piece, which looks forward to where we could be headed.
This is the first time we have devoted so much time to one topic. Maybe you are ready to move on to things that feel more relevant to you: the war, gas prices, inflation, labor data. There's no shame in that, and we can see it in the open and click stats on this series against those other topics.
But let's be real. This is food we are talking about. Try going a day without it and see what else matters to you. The people we are writing this for don't have the luxury of reading it. They are thinking about where their next meal comes from, or how to feed their family tonight. How many other problems wouldn't be problems if we could just feed Americans properly? We will never know until we fix the food problem. That is why we have devoted eight days to it.
Those of us who don't have to worry about where our next meal comes from are the ones with the power to end food insecurity for others. We just have to make it our problem. Step one is getting educated about how this all works. So stick with us. We are almost there.
To connect all the dots, let's go back to where we left off yesterday — the 976 ZIP codes that lost their last SNAP-authorized chain pharmacy between 2021 and 2025. For these ZIP codes, here is the trend of authorized SNAP food stores over twenty years.
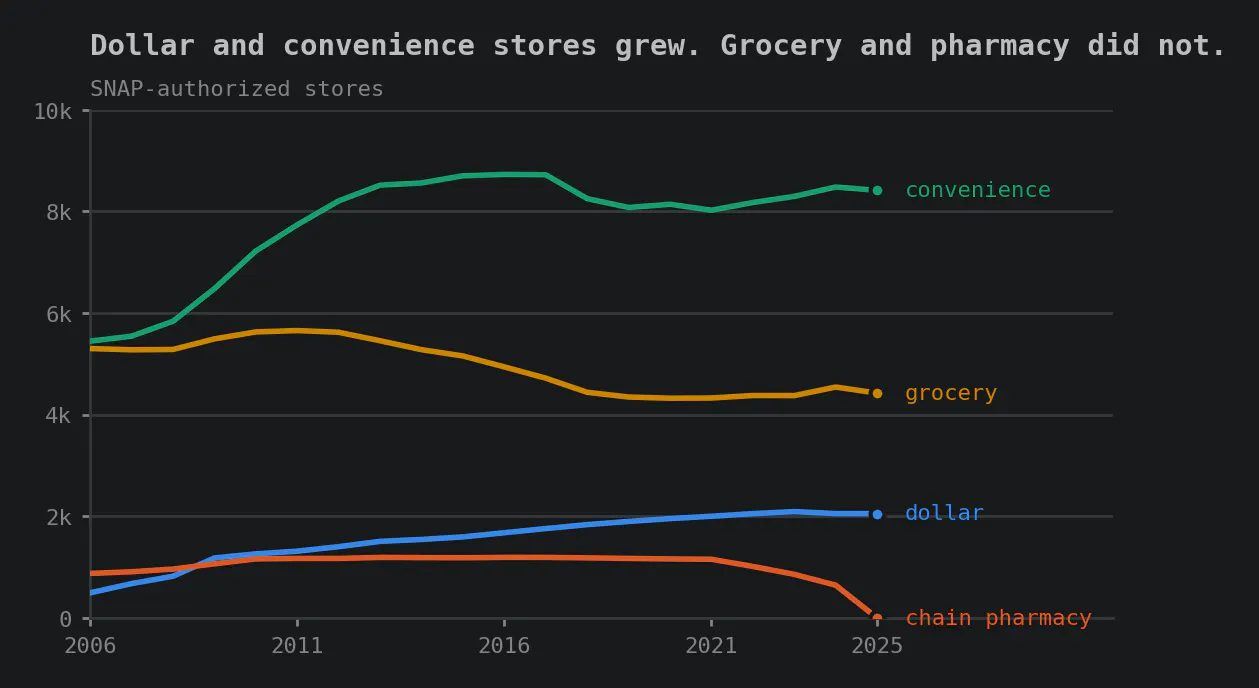
Dollar stores went from 494 to 2,054 — +316%. Convenience stores went from 5,447 to 8,413, up 54.5%. Grocery of every size went the other way, 5,301 down to 4,425, a fall of 16.5%. Pharmacies peaked at 1,192 in 2016 and are now at zero.
Look at what that does to the mix. In 2006 convenience and grocery were essentially level in these places, and grocery outnumbered dollar stores by roughly ten to one. Today convenience outnumbers grocery by nearly two to one, and grocery leads dollar by only about two to one. Two formats that began level, and diverged. The direction of travel is unambiguous.
USDA's assumptions don't hold up against reality
It's worth pausing on the stark contrast between what these places had in 2006 and what they have now. To make it hit home, here is the mix in two pictures.
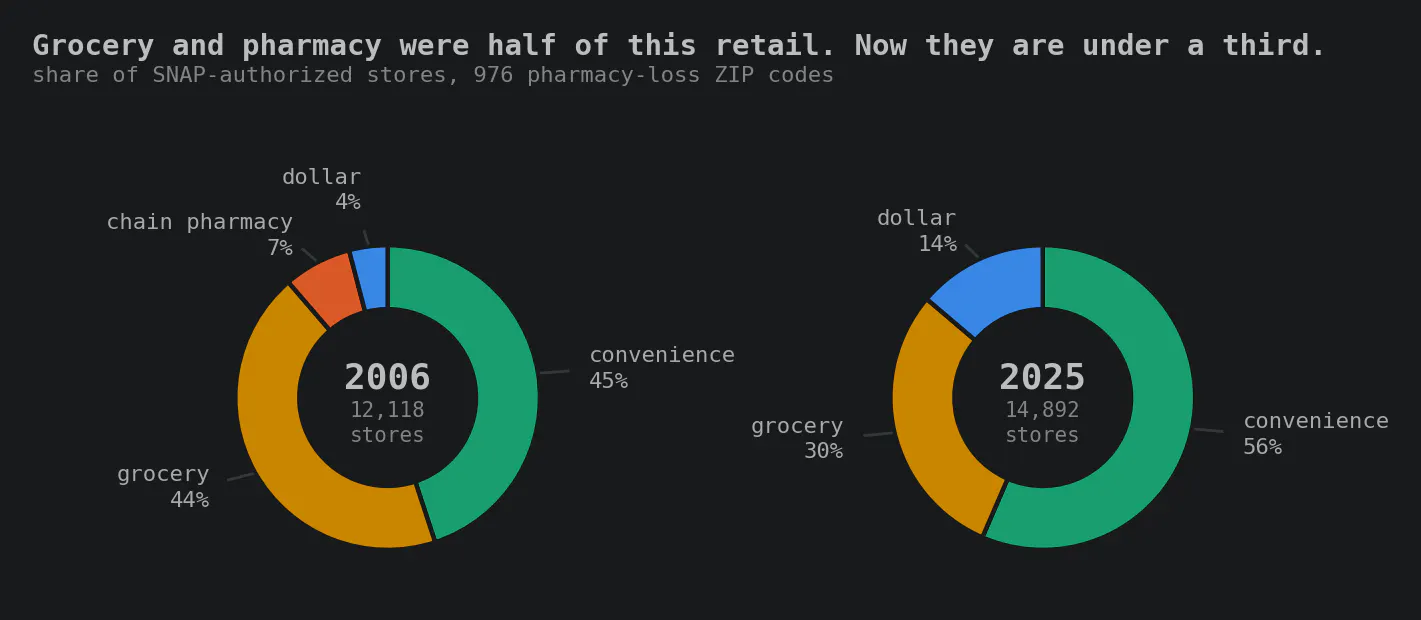
Look at the compression in grocery stores and chain pharmacies. Together those two were 51% of all the SNAP-authorized food retail in these ZIP codes in 2006 — more than half. Today they are 30%. The total number of stores went up over those twenty years, from 12,118 to 14,892. There is more retail here than there was. There is just less of the kind that sells a week of groceries.
Which means these ZIP codes have more places to shop offering a narrower selection of food. We keep harping on this because of the dissonance between the theory USDA cooked up in its Thrifty Food Plan — a way, on paper, for a family of four to eat a healthy diet on about $229 a week — and the access those families actually have to a store where that diet can be bought. If anything comes out of this series, let it be the wake-up call USDA needs: get out of the spreadsheets and into the real stores of the vulnerable Americans it claims to support.
That is the aggregate. Here is what it looks like in one place. Mount Clemens, MI — a ZIP code of 15,665 people — had 2 grocery stores, 1 chain pharmacy, 2 dollar stores and 13 convenience stores in 2006. Today it has 10 convenience stores and 3 dollar stores, and neither a grocery store nor a chain pharmacy.
Glassport, PA is smaller — 4,475 people — and had one of each in 2006: a grocery store, a chain pharmacy, a dollar store, a convenience store. It now has 4 convenience stores and 4 dollar stores. Twice as many food retailers as it had, and not one of them sells a week of groceries. Waynesburg, OH, population 2,958, had the same four and is down to a single convenience store and a single dollar store. Canton, OH has 8,923 residents, 2 convenience stores and 1 dollar store.
Eight ZIP codes in this group had all four formats in 2006 and have neither a grocery store nor a chain pharmacy today. They are not exotic places. They are in Ohio, Pennsylvania, West Virginia, Michigan and Arkansas.
Don't blame the dollar stores
Before we move on, we wanted to check one thing. Did the surge in dollar stores and convenience stores push the grocers out? Or did these formats come to the rescue, filling a void that was already forming?
The answer is that we cannot blame the dollar stores for the demise of the grocers. Nationally, 2,267 ZIP codes had a grocery store in 2006 and have none today. 40% of them never had a dollar store at all — 919 places that lost their grocery with nothing of the sort in town to blame.
Where dollar stores did arrive, grocery held up better, not worse. Take every ZIP code that had a grocery store in 2006: the ones that gained a dollar store since are up 2.5% in grocery stores, and the ones that did not are down 5.3%. That is not proof the dollar store helps — these chains open where the customers already are, and that alone would produce the same pattern — but it is the opposite of what pushing someone out looks like.
If anything, it very much appears access to food in these places could have been a good deal worse had the smaller formats not come to town. They did not take the grocery store. They are just most of what is standing now that it has gone.
What these places actually have in common
So if the dollar store did not do it, what did? The distinguishing feature of these places is not what arrived. It is how small they are.
To gauge that relationship we zoomed back to 2006, the earliest date we have, and ran the same test twice. Take every ZIP code that had a chain pharmacy in 2006, and see which of them still has one today. Then do the same for grocery stores.
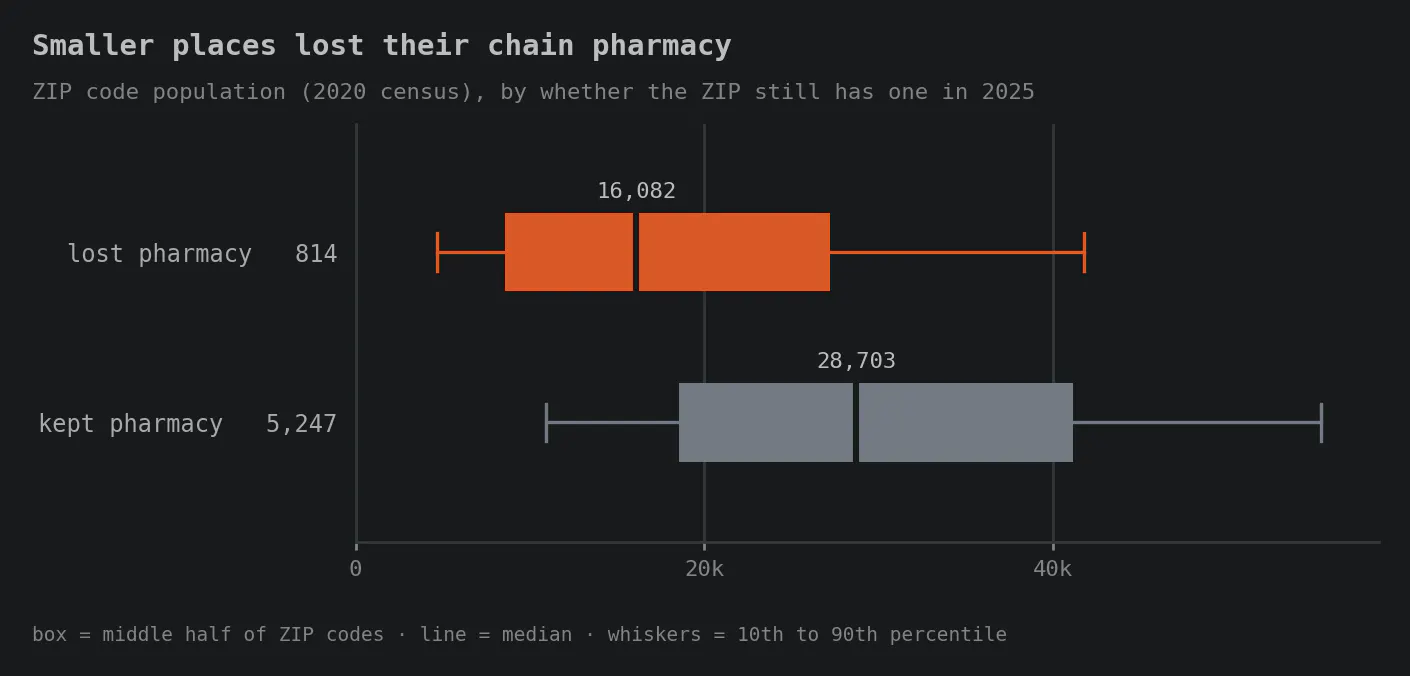
Start with the pharmacies. Of the ZIP codes that had a chain pharmacy in 2006, the ones that have none today have a median population of 16,082. The ones that still have one, 28,703. The two overlap — plenty of large ZIP codes lost a pharmacy — but the whole distribution sits lower.
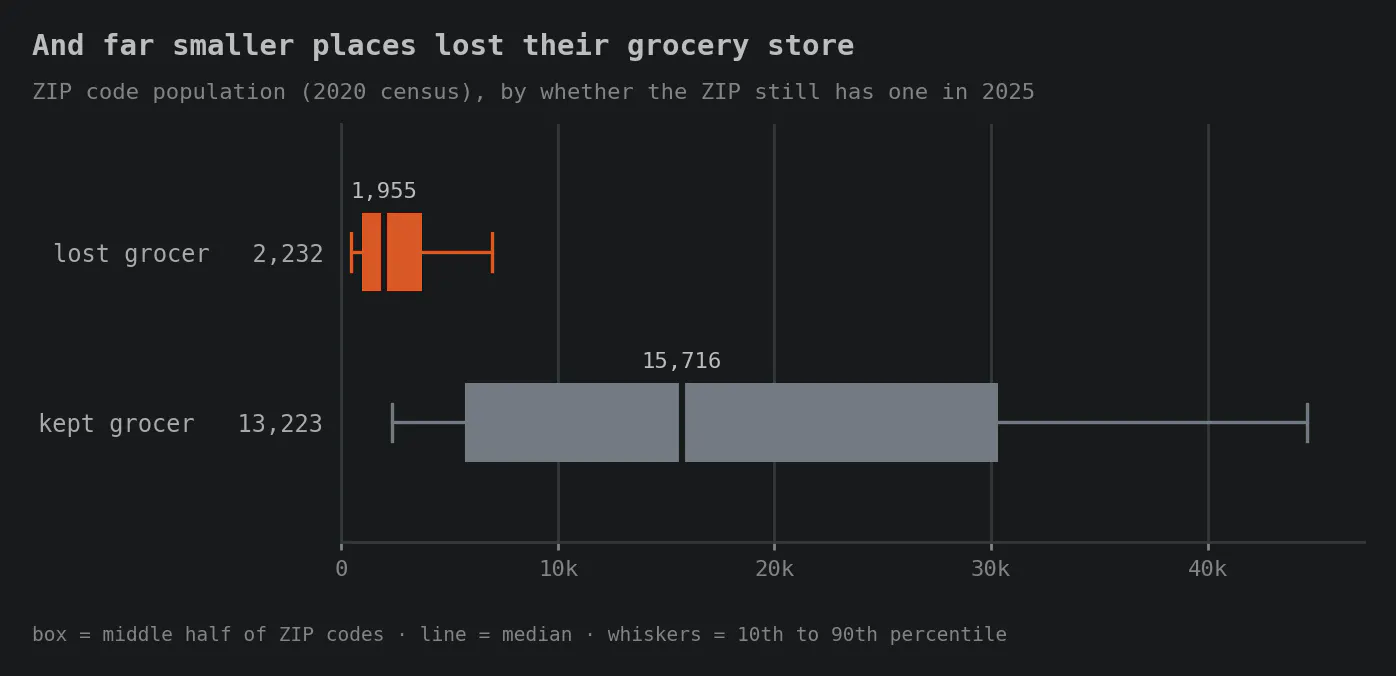
Now the grocery stores, where it is not a shift but a chasm. Of the ZIP codes that had a grocery store of any size in 2006, the ones that have none today have a median population of 1,955. Half of them fall between 956 and 3,740 people. Half of the ZIP codes that kept a grocery store fall between 5,717 and 30,308.
Stitching together our fractured country
This series started with the goal of understanding the change in authorized SNAP retail locations over the past two decades. Over seven days it has morphed into something larger — a study of the widening chasm between two Americas.
It's obvious why this matters for the "have-nots." Put yourself in the shoes of someone living in a town with no pharmacy and no grocery store — and thus no way to buy the tilapia the Thrifty Food Plan lists as a staple for families on SNAP — on 130% of the federal poverty level, $42,900 a year for a family of four. Then think about how meaningless something like yesterday evening's Nvidia earnings release, an event that monopolized the attention of so many of the "haves," must seem.
But if you are lucky enough to be one of the "haves," the struggle of the "have-nots" matters for you too. We don't all have equal bank accounts, but we all have equal votes. And votes determine the future of this country. You may not agree with how others vote. But have you really tried to understand them? Have you tried to imagine the life they have had to live? If you don't understand other people's lived experience, and how different it may be from your own, how can we criticize how they choose to vote?
This is the problem, in my view. We have largely stopped trying to understand others, and jump to judging them instead. Data can help us understand, but only if we bring a beginner's mind to the analysis. And truly understanding others is the first step to stitching this country back together.
So let's use this data to understand — for a start, how people feed themselves. Maybe try grocery shopping one week at a dollar store only. Maybe set your family's grocery budget at $229 for a week, and see how that feels when you get to Thursday. Data can help us identify our shortsightedness. It is experiences like these that have the potential to solidify our learning and our empathy.
Tomorrow: a glimpse into how the future could get even more unequal, thanks to coming rule changes.
Limits
Every figure here counts SNAP authorizations, not storefronts. For the pharmacy chains those are nearly the same thing: Walgreens held 7,800 authorizations at the end of 2024 against the 8,454 US stores its own annual report counted four months earlier. For independents they are not the same, and this series does not treat them as such.
The town examples count chain pharmacies only, the same brand list the rest of this series uses. A town shown here without a pharmacy may still have an independent one; this data cannot see it, for the coverage reason set out in Day 5. The same goes for a grocery store that is not SNAP-authorized.
The control group is ZIP codes that had a chain pharmacy in 2021 and kept one. It is not a matched sample: the two groups differ in population, which is the finding rather than a nuisance. Read the comparison as descriptive, not causal.
Counties are classified by their 2023 Rural-Urban Continuum Code, as in Day 4. A ZIP code does not nest inside a county, so each is assigned the modal county of the stores recorded in it; one straddling the metro line goes to whichever side holds more of them.
Population is 2020 census by ZCTA, which approximates but does not exactly equal a ZIP code. 972 of the 976 pharmacy-loss ZIPs matched a ZCTA.
Nothing here measures sales, floor space, assortment or prices. A dollar store and a supermarket each count as one record, and the question of what is actually purchasable in these places needs a different source.
Source: USDA FNS SNAP Retailer Locator Historical Data, 2005–2025, and 2020 Decennial Census (DHC, table P1) population by ZCTA. Analysis uses 656,868 stores with usable coordinates; a store counts as active in a year if an authorization covered 31 December. Fuel-chain survival and margin figures are from the gas station chapter. Code, pipeline and verification: Data4ThePeople/SNAP_Locations.
Support Data That Serves the Public
Data should empower people, not just institutions. Your support helps us create accessible research, visualizations, and tools that uncover economic inequality and inform better decisions.
Donate
Enjoying this post?
Tell others about it.
More articles like this
Fetching Related Posts
There are no other articles tagged with Data 4 Thought