

Half of Dayton's cheapest apartments are gone
25,000 units under $750 a month, gone in five years. A tornado took some. The market took the rest.

Eric Pachman
Published
June 24th 2026
Dayton, Ohio. (Photo: Michael Bowman / Unsplash)
Dayton 4 The People?
We're staying local with today's Data 4 Thought. Yesterday I told a story about the place I was born, NYC. Today, I'm shifting to where I now live, Dayton. Specifically, today's story is about the declining affordability of rent here in Dayton, OH.
But before I tell you that story, I need to tell you this.
On the night of May 27, 2019, Memorial Day, a tornado outbreak tore through the Dayton area. Sixteen tornadoes touched down that night, the largest an EF4 that carved an 18-mile path through Montgomery County with winds up to 170 mph. It hit Trotwood hardest, a working-class suburb where about half the residents rent and the median household income was just $32,977.

Image: National Weather Service
The damage to affordable housing was severe. According to Ohio's official disaster recovery plan, 629 apartments were destroyed and another 120 damaged, with more than 1,100 apartment buildings affected. Roughly 1,800 people in Trotwood's multifamily housing were forced out. Some complexes were never rebuilt at all. Foxton Court, in north Dayton, was demolished and the land is now a MetroParks trail. Others, like Woodland Hills in Trotwood, sat in ruins for years. And where units were eventually replaced, many came back at rents the previous tenants could no longer afford. The first significant affordable replacement, a 131-unit project, didn't open until 2026, seven years later, and a fraction of what was lost.
The tornadoes were a very real (and sad) driver of a decline in low income housing in Dayton. But there are also hidden economic forces occurring in Dayton, and for that matter, all across the country, that are pushing rental units upward in price - the simple truth that a developer can make far more profit building $2,500 per month units than $500 per month units. So, absent strict government regulation to ensure low income housing development, why would it happen?
In other words, there is gravity in economics, and that gravitational pull when it comes to rental units is towards more expensive ones.
Let's see how this played out in the data.
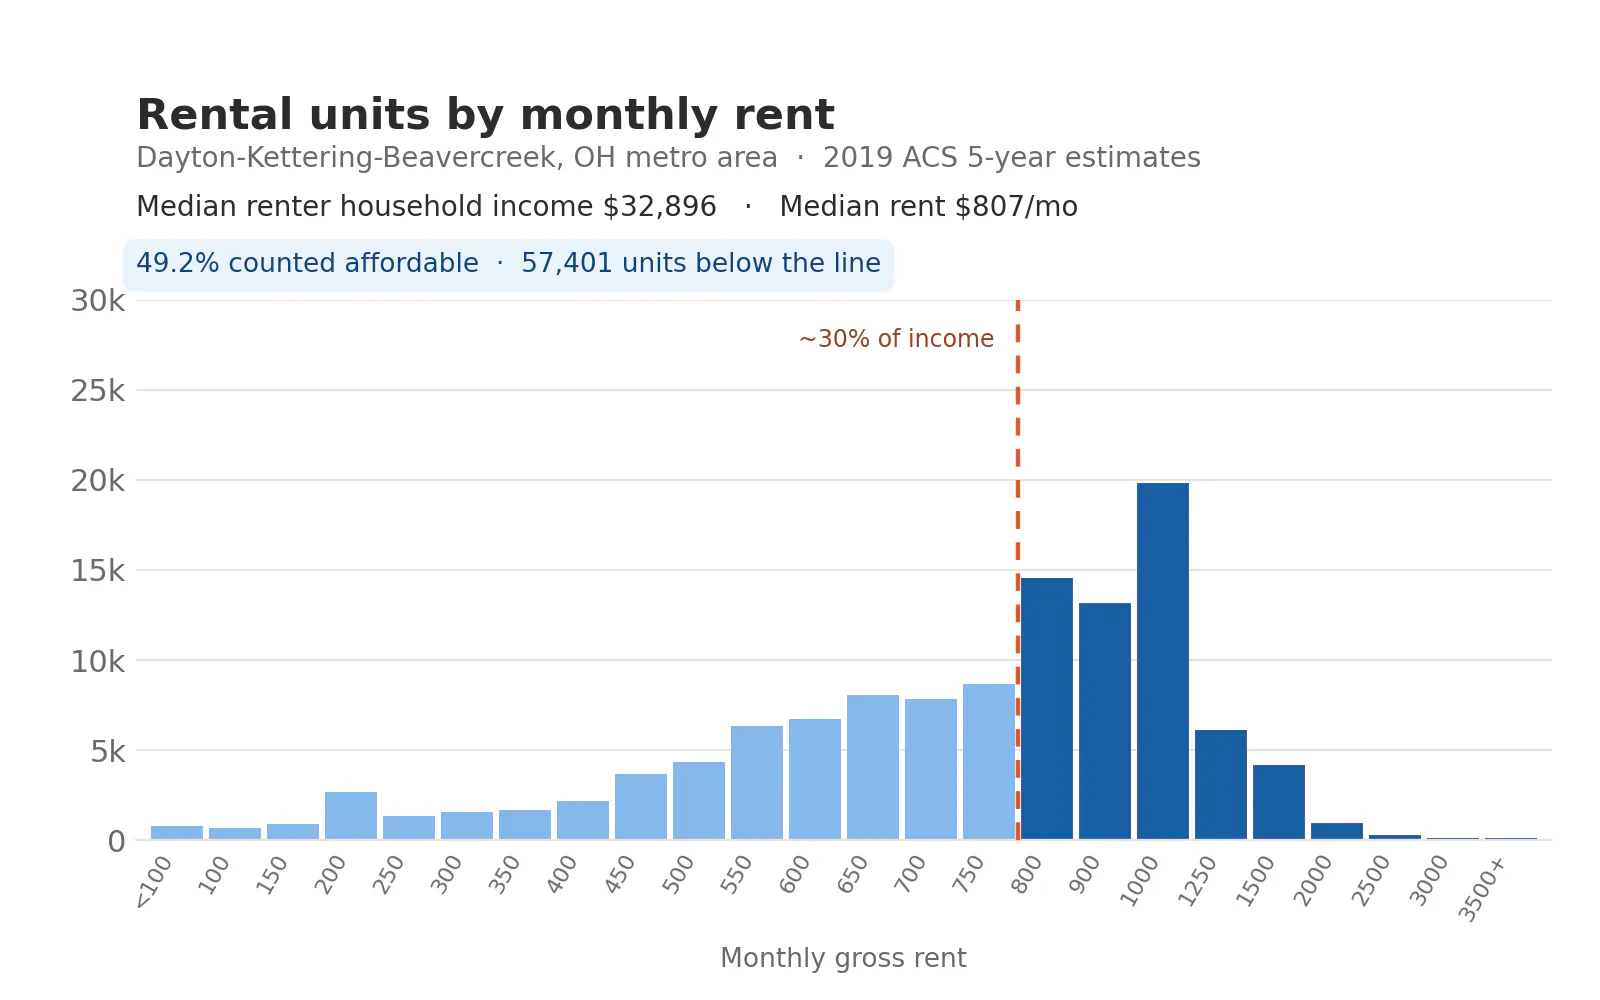
We'll start by showing you a histogram of the number of units available at each price point in the Dayton-Kettering-Beavercreek MSA ("Dayton") as reported in the 2019 5-year American Community Survey (ACS). We've drawn a line right around 30% of the median renter's income, the familiar rule of thumb that you shouldn't spend more than 30% of what you make on rent. For 2019, that line lands at $800 a month. We counted a unit as affordable only if its entire price bucket sits below that line, the same conservative way in both years (more on that at the end). By this measure, about 49% of Dayton's rental units were affordable in 2019.
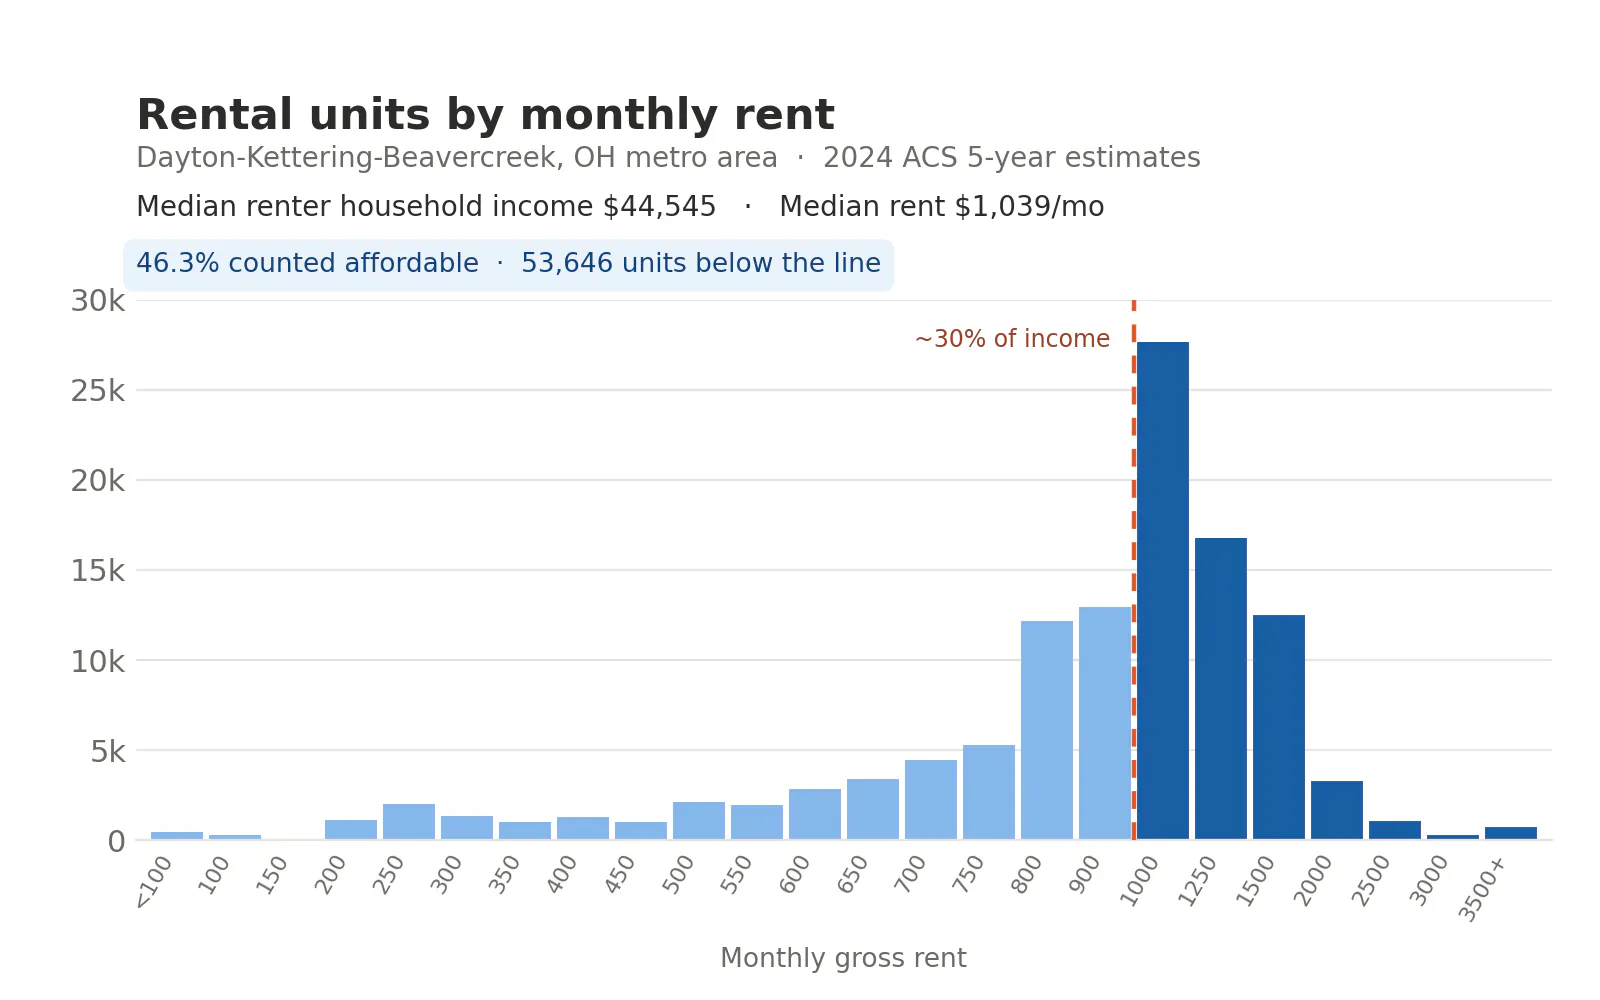
Now let's fast forward five years to the 2024 5-year ACS Survey results for Dayton. Note that the median household income of renters rose 35% over this five-year period, and the median rent rose from $807 to $1,039, about 29%. So on the typical renter, income slightly outpaced rent. Not bad. But let's not celebrate this yet, because the data shows that Dayton's affordable units, counted the same conservative way, dropped to 46%. That may not seem like much of a drop, but the charts also show the numbers. Over five years, Dayton lost 3,755 affordable units and added 2,986 unaffordable ones, even though we moved the 30% line up to fully credit that 35% raise. So much for the increase in median income for renters. It turns out that the goal post was moved even further.
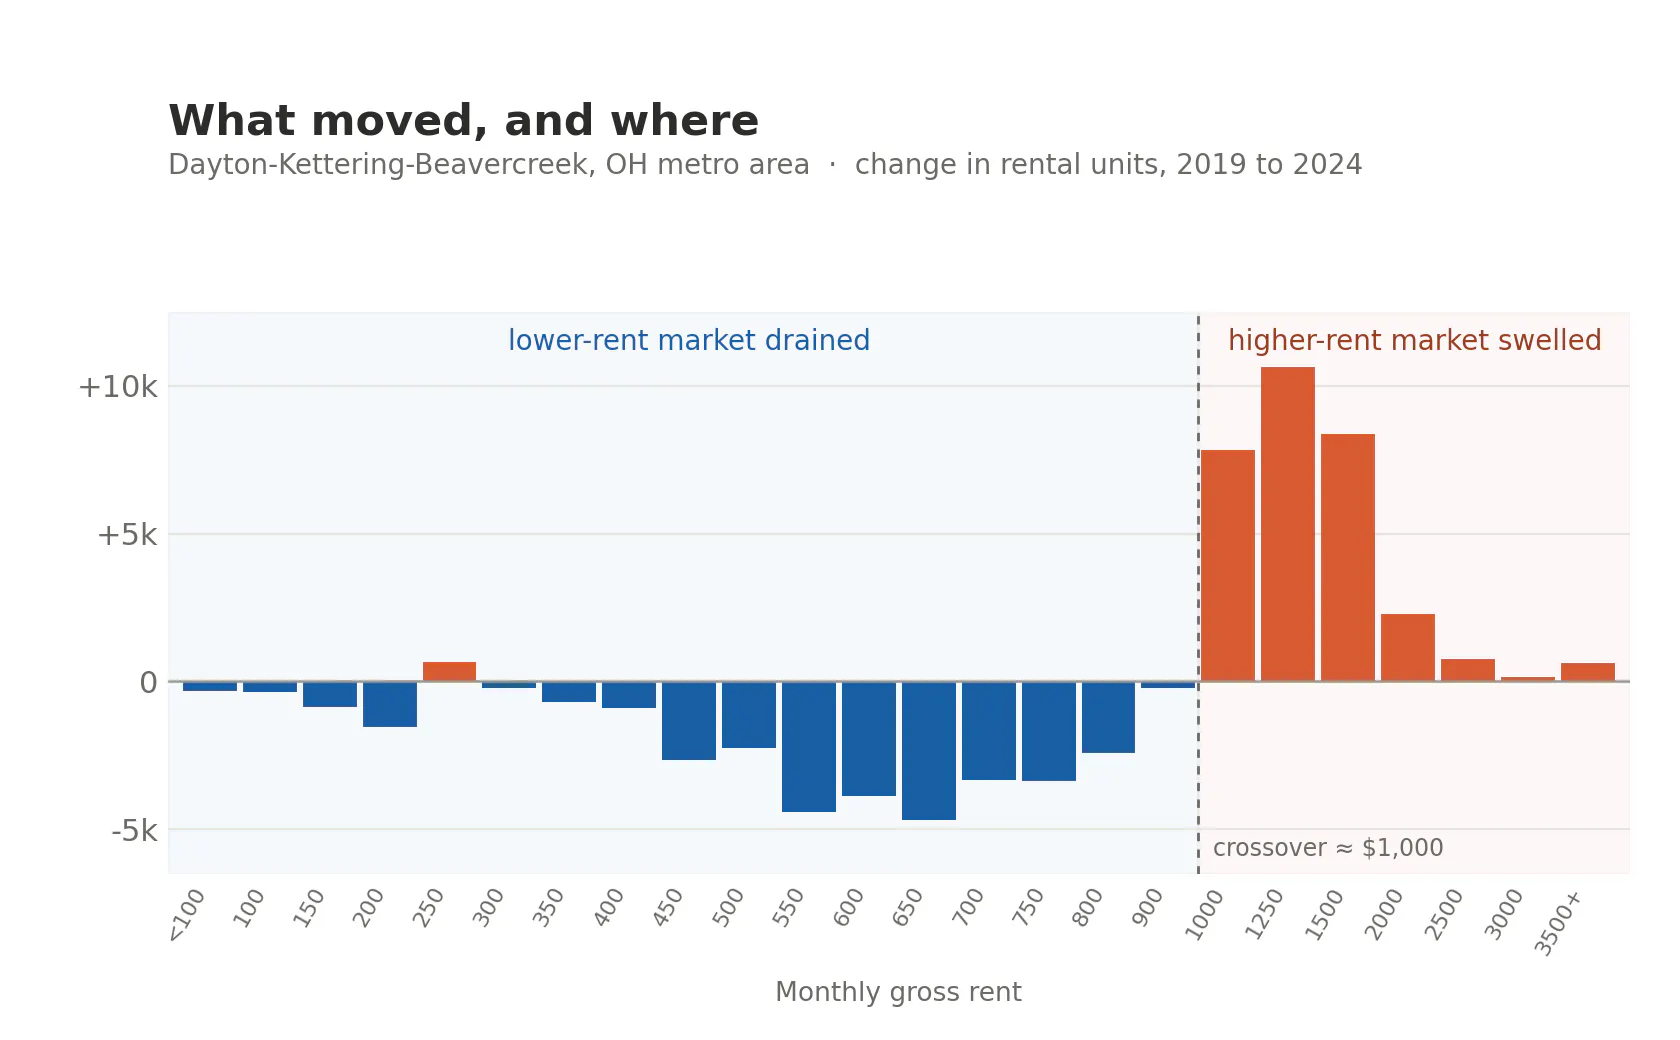
Now let's combine these two histograms into a third, where we calculate the change in the number of units in each bucket. This shows what really happened at a more granular level. The lower-rent market was drained, while the higher-rent market swelled.
The pattern is almost eerily symmetric. Below $1,000 a month, Dayton lost a net 31,481 units. At $1,000 and above, it gained 30,712. In other words, for nearly every lower-rent unit that disappeared, a higher-rent one appeared in its place. And remember, the total number of rental units barely changed at all, from 116,730 to 115,961. This wasn't a building boom that added units on top of the existing stock. It was the same stock, walking up the price ladder.
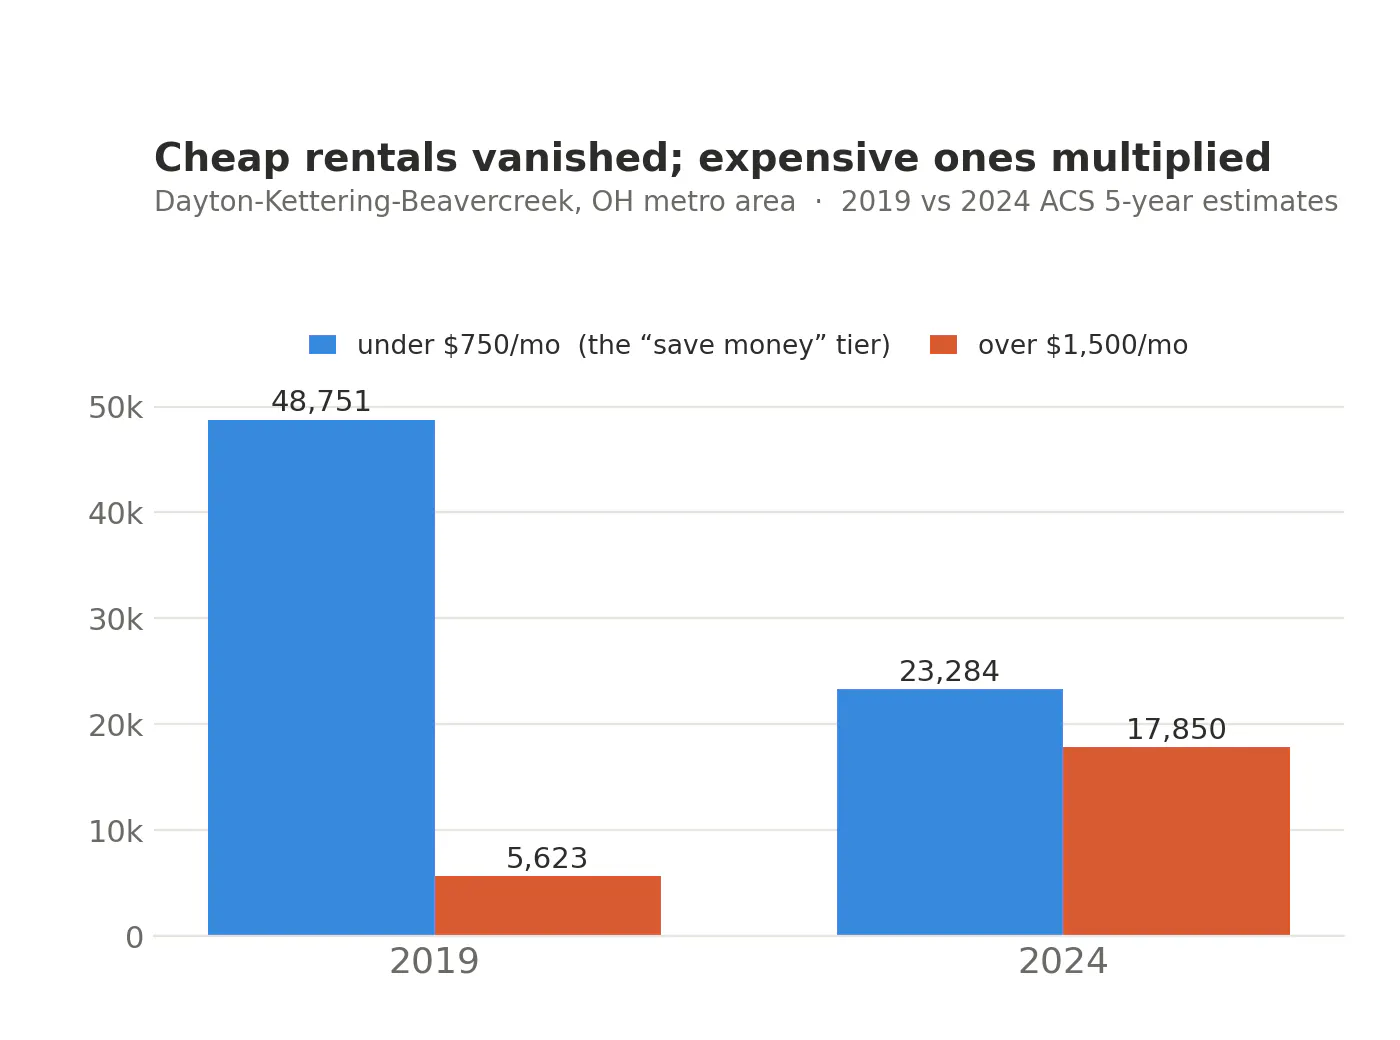
We then drilled down even deeper into what we'll call the "cheap" and "expensive" groups of rentals, where cheap is under $750 and expensive is $1,500 or more. We were especially interested in the cheap stock, because finding a more affordable unit is one of the few ways a household can actually get ahead when its income rises.
Here's what happened instead. In 2019, Dayton had 48,751 rental units priced under $750 a month, the kind of rent that lets a household actually save. By 2024, that number had fallen to 23,284. More than half of Dayton's cheapest rental stock, over 25,000 units, simply vanished in five years.
Meanwhile, units renting for $1,500 or more went the other direction, from 5,623 to 17,850 - more than tripling.
Put those two facts side by side and the shift is stark. In 2019, Dayton had nearly nine cheap rentals for every expensive one. By 2024, it had barely more than one. The ladder didn't just get taller. The bottom rungs were sawed off.
This is Dayton's story. We should not be surprised. The system gets the outcome it was designed to produce. And right now, our system is designed to produce profits, not affordable housing. There is nothing inherently wrong with profits. But if we don't provide guardrails (i.e., "the rules of the game") for those seeking them, we can't complain when this situation plays out.
Gravity, whether physical or economic, doesn't negotiate - and neither will the housing market, until we decide it has to.
A note on method. The Census reports rent in buckets ($750 to $799, $800 to $899, and so on), and our 30% affordability line almost never falls neatly on a bucket edge. It tends to land somewhere inside a bucket. Rather than guess how units are spread within that bucket, we took the conservative route: we counted a unit as affordable only if its entire bucket sits below the line, and drew our dividing line in the gap between buckets. This slightly undercounts affordable units in both years (it sets aside the one bucket the line passes through), but it does so identically in 2019 and 2024, so the comparison stays fair and rests on no assumption about how units distribute inside a price band.
The underlying data is publicly available at data.census.gov. Unit counts by rent bucket come from ACS Table B25063 (Gross Rent); median gross rent from B25064; and median renter household income from B25119. All figures are drawn from the 2019 and 2024 5-year ACS estimates for the Dayton-Kettering-Beavercreek, OH Metro Area, filtered by survey period and geography.
Replicate this for where you live. We dare you.
Support Data That Serves the Public
Data should empower people, not just institutions. Your support helps us create accessible research, visualizations, and tools that uncover economic inequality and inform better decisions.
Donate
Enjoying this post?
Tell others about it.
More articles like this
Fetching Related Posts
There are no other articles tagged with Data 4 Thought