

Health insurance down 8%? Drug prices down 3%? Meet CPI.
Why the most famous U.S. inflation measure doesn't really measure inflation.

Eric Pachman
Published
August 13th 2026
The CPI Merry-Go-Round
I didn't plan on writing this morning. Amanda and I have been working around the clock rebuilding processes and finalizing our nonprofit conversion — an endless list of to-dos that must be sequenced in exactly the right order. We check one item off and four more replace it.
Point is, today was supposed to be a rest day.
Then the Bureau of Labor Statistics released July's inflation data — the Consumer Price Index, or CPI — and our rest day got blown to smithereens.
If there is one thing that gets under my skin, it's bad data. Worse is bad data that leads to bad decisions and false narratives. Worse still is bad data that persists, breeding complacency. And worst of all is when it comes from our own federal government.
That happened today. So the rest day will have to wait.
The monetary policy game
You don't need a lecture on how the Federal Reserve sets policy — just this: investors don't want the Fed to raise rates. Higher rates mean less speculation in risk assets. If inflation runs too high, the Fed is forced to raise rates, and the merry-go-round that is the stock market could crack and fall. So the Fed watches two inflation numbers — CPI (the consumer's experience) and PCE (the whole economy's).
Today the BLS said CPI in July was 3.4% higher than a year ago — well above the Fed's 2% target. But that includes food and energy, which a Fed chairman decided decades ago to strip out of "core" inflation as too volatile. (Coincidentally — or not — that was in the 1970s, the last time we faced an energy crisis of this magnitude. The food exclusion, I'd add, was arbitrary.) So "core" inflation rose just 2.5% — a number decidedly closer to 2%, and one that keeps the merry-go-round turning.
Lower health insurance and prescription drug costs are keeping a lid on inflation… HUH?!
I have spent years studying the items that comprise CPI. So when the data doesn't jibe with the People's lived experience, I get curious about what's driving it. I scanned the release and immediately found two numbers that seemed very wrong:
- Health insurance costs declined 8.0% versus last year.
- Prescription drug prices declined 3.1% versus last year.
One more thing to know: every CPI item has a weight — think share of wallet. Health insurance and prescription drugs each carry nearly 1% of the entire index. That may not sound like much, until you consider that "pets and pet products" gets about 0.6%. So, CPI says you spend roughly 50% more on each of these health care items than you do on your beloved dog or cat. These are meaningful numbers, and they don't pass the sniff test. But a sniff test isn't good enough here at Data 4 The People.
So we checked the tape.
The BLS doesn't measure your health insurance premium. Really.
Straight from the BLS's own methodology factsheet: the CPI health insurance index does not track premiums.
Instead, the BLS uses the "retained earnings method." Think of your premium as a pie. Most of it gets paid out to doctors, hospitals, and pharmacies as claims. Whatever's left — the slice the insurer keeps for overhead and profit — is "retained earnings." The BLS tracks only the size of that leftover slice, using industry financial reports that arrive roughly ten months late, smoothed over two years. (Why? The BLS says it can't fairly compare premiums when plan benefits keep changing, so it punted and measured insurer margins. The claims portion of your premium gets scattered into the doctor, hospital, and drug indexes.)
Follow the logic to its absurd conclusion: when insurers have a bad year — paying out more in claims than planned — the CPI says health insurance got cheaperfor you. Even if your premium went up.
That's exactly what's happening. Insurers just lived through a brutal stretch: surging utilization, GLP-1 spending, and Medicare drug benefit losses crushed their margins in 2024 and 2025. Their leftover slice shrank. So the CPI — working off that lagged data — reports that "health insurance" fell 8%.
Meanwhile, back on Earth, every credible measure of premiums points the same direction — up, a lot:
- Employer coverage (KFF 2025 Employer Health Benefits Survey): average family premium $26,993, up 6% — after 7% jumps in each of the two prior years. The worker's share rose from $6,296 to $6,850, up 8.8%. The average single deductible climbed 6.4% to $1,886.
- ACA Marketplace (KFF): 2026 premiums charged by insurers rose 26% on average. What enrollees actually paid jumped 58% — from $113 to $178 a month — after Congress let the enhanced subsidies expire. Even that understates it: families softened the blow by trading down to skimpier plans, and the average Marketplace deductible grew by roughly $1,000 per person in one year.
- Medicare Part D: the average drug-plan deductible in Medicare Advantage went from $64 in 2024 to $228 in 2025 to $371 in 2026. Premiums only look tame because taxpayers are spending billions on a temporary "stabilization" subsidy that ends after this year.
Premiums up. Patient payments up. Deductibles up everywhere. Official inflation report: minus eight percent.
What would core inflation look like with real numbers?
Let's do what the BLS won't. Health insurance carries a relative importance of 0.826 — about 1% of the "core" basket. Keep the BLS's own (tiny) weight, and swap the -8.0% for what consumers actually paid.
Our assumptions, stated plainly. CPI claims to measure consumer inflation, and the BLS's own Consumer Expenditure Survey — the source of every CPI weight — counts only the premiums consumers pay; the employer's share is excluded from the basket entirely. So we measure premiums the same way: what came out of your paycheck and bank account.
- Employer coverage (~154 million people): worker share of the family premium up +8.8% (KFF; single-coverage contributions were roughly flat, so this is the family-tier figure).
- ACA Marketplace (~22 million people, 2025 effectuated enrollment — those actually paying premiums): average premium enrollees actually paid up +58% (KFF). Yes, part of that is the subsidy expiring rather than the sticker rising. We count it deliberately: a tax credit disappearing raises the consumer's price just as surely as a rate hike does, and the consumer's price is what CPI claims to measure.
- Enrollment-weight the two markets: consumer-paid premium growth of +15.0%.
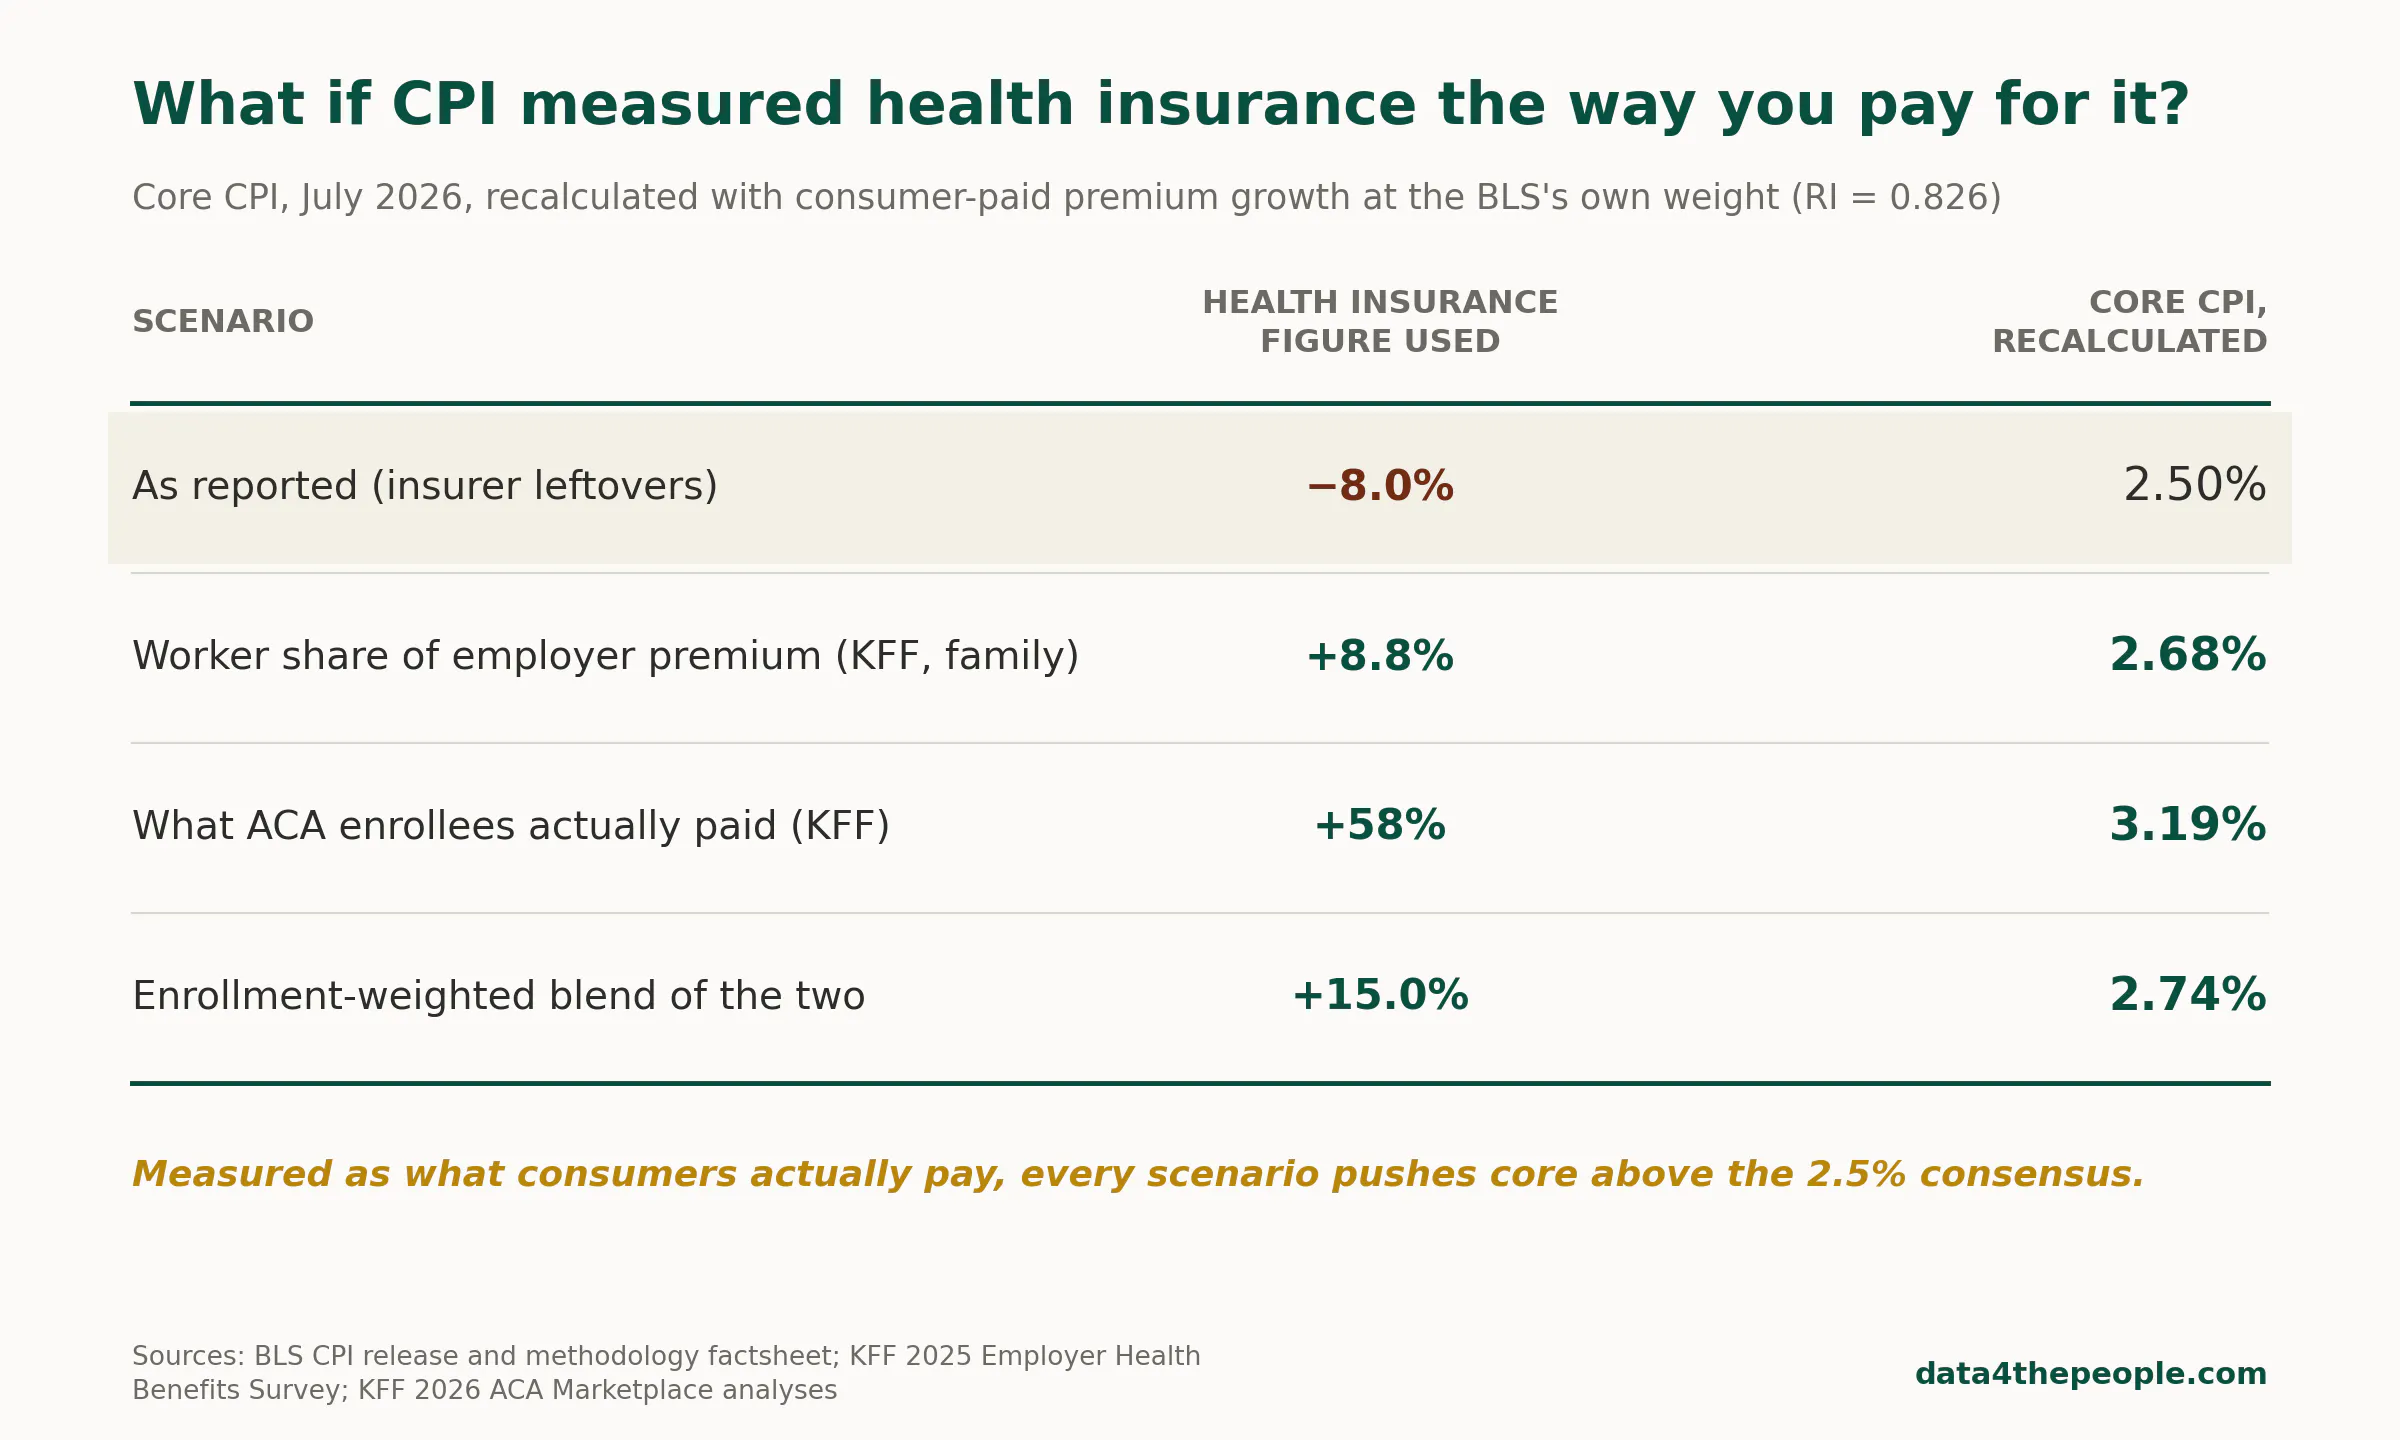
(For skeptics keeping score: price the insurance product instead — full premium, employer share included, subsidy changes ignored — and you'd blend +6% employer growth with the +26% ACA sticker increase for +8.7%, putting core at ~2.67%. Every road leads above consensus.)
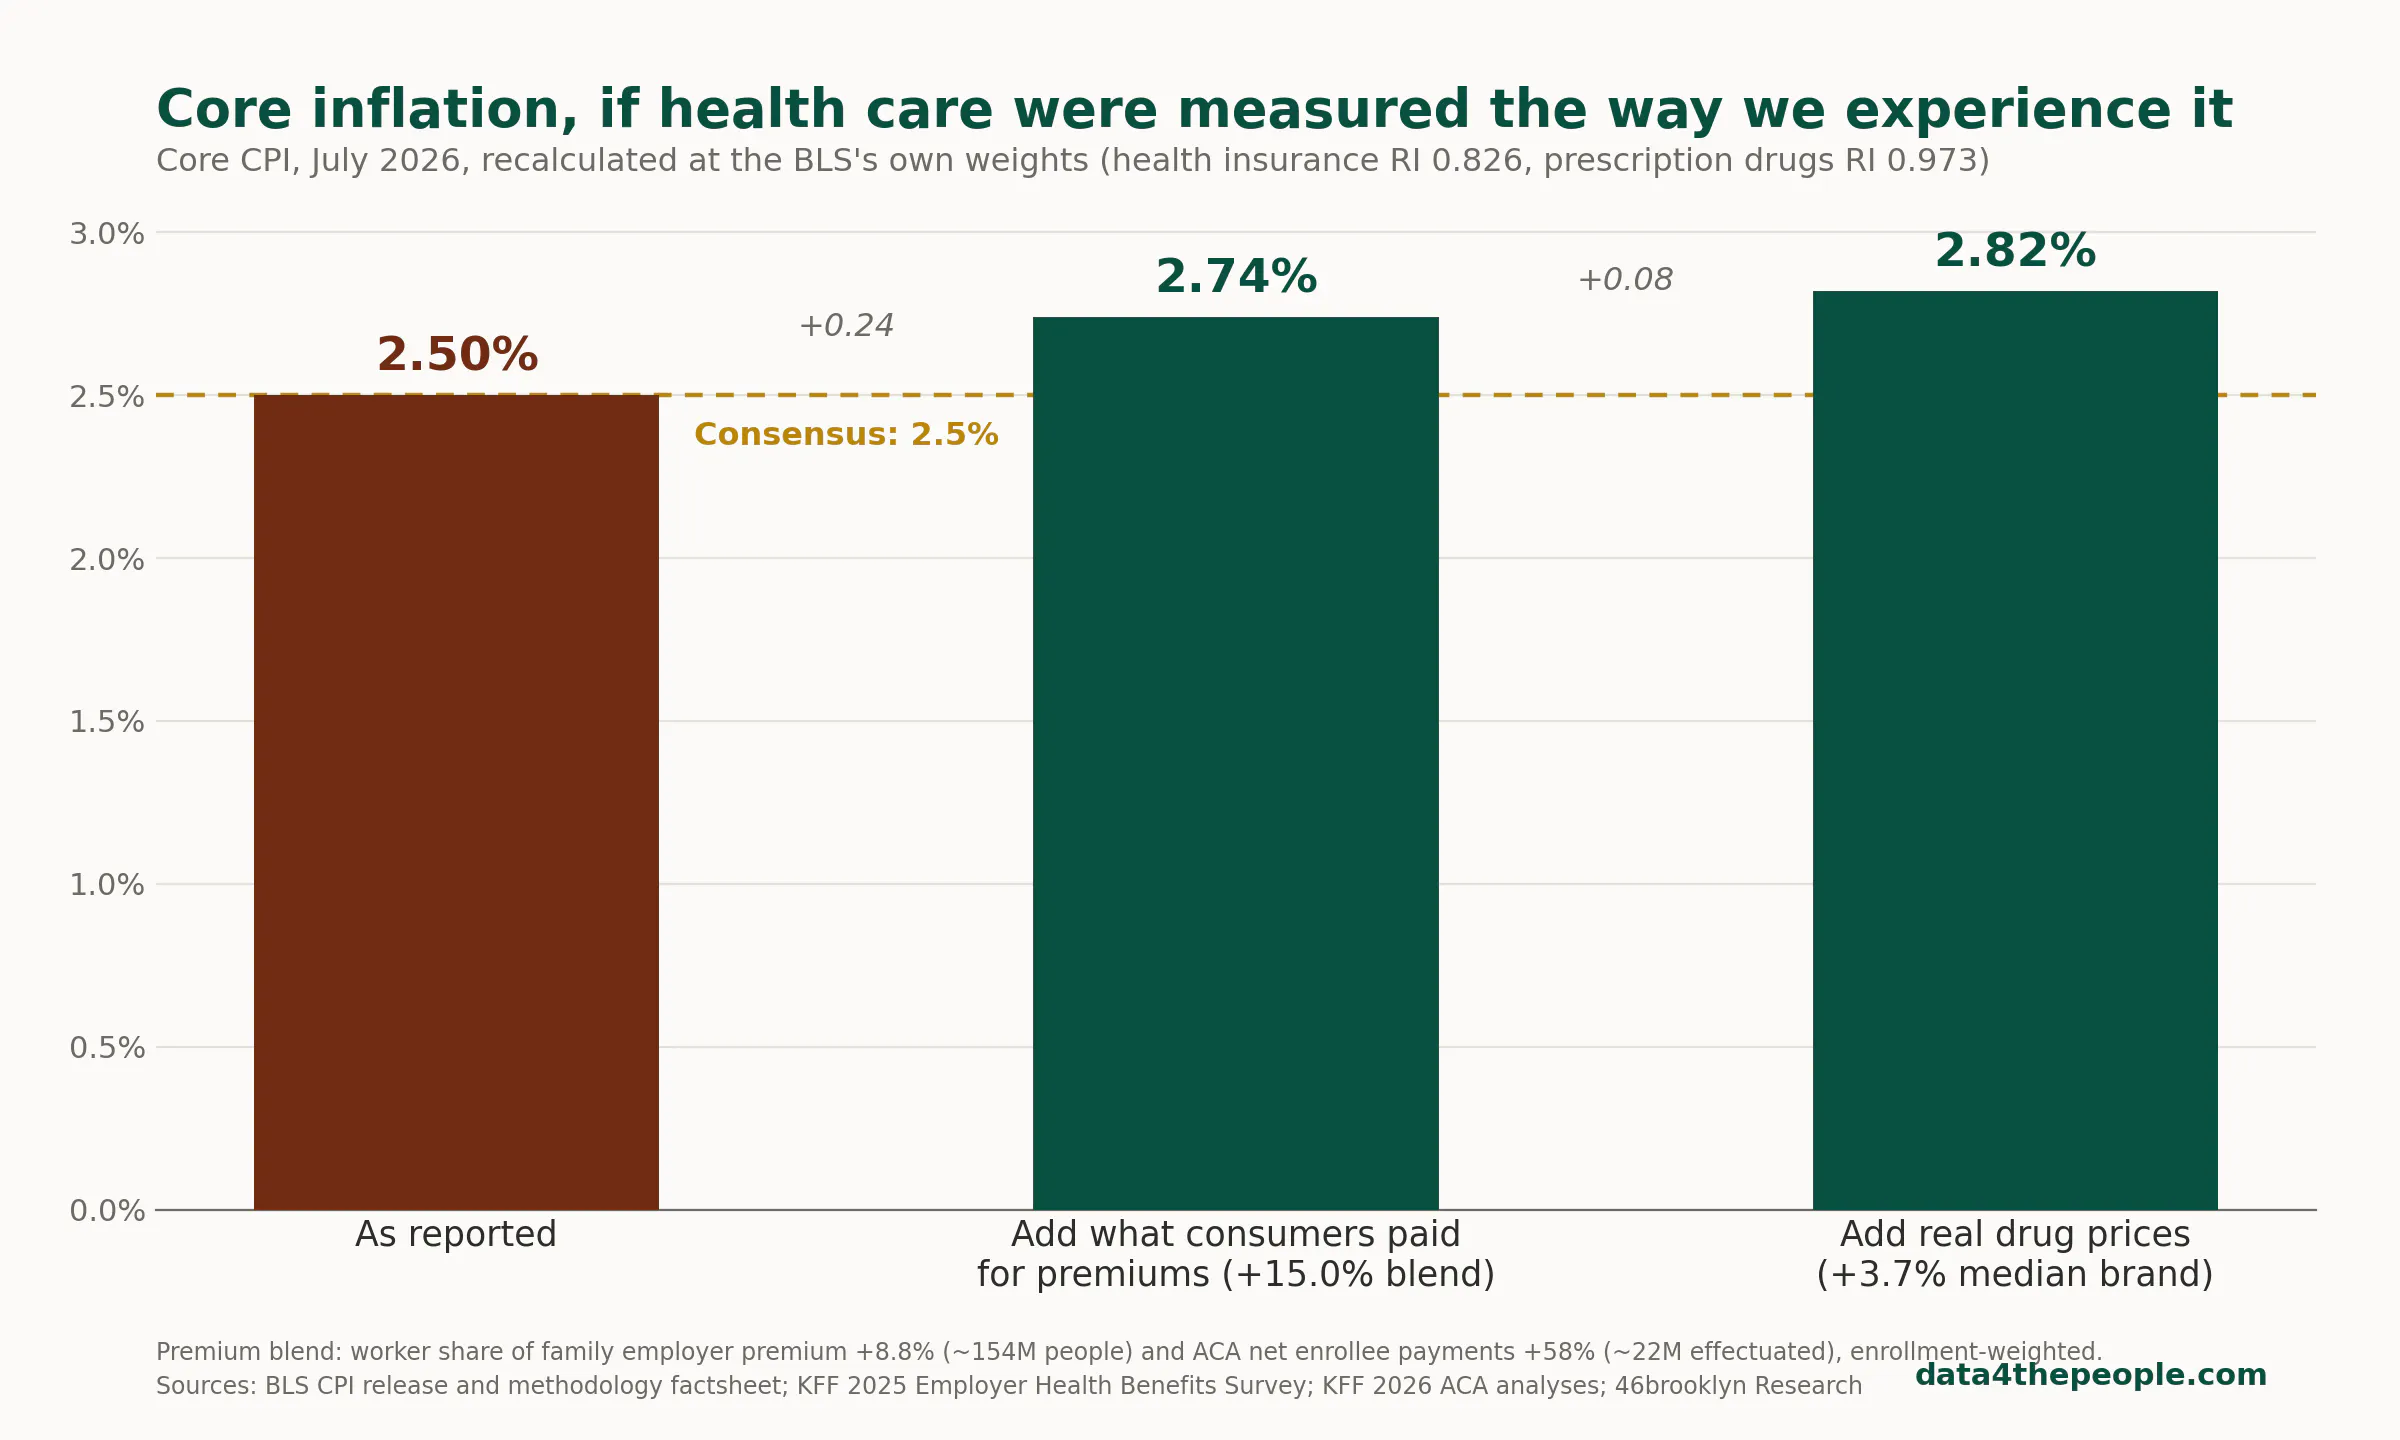
So this one line item — measured the way no human being experiences it — is shaving roughly a quarter of a percentage point off reported core inflation. And consider: Wall Street's consensus for today's core number was 2.5%. The print landed exactly on it — no surprise, no drama, merry-go-round intact. Swap in any real-world measure of health insurance and today would have been an upside inflation surprise.
And friends, even that understates it. Households spend close to 5% of their budgets on health insurance premiums — the Consumer Expenditure Survey says so. The BLS just doesn't let the "health insurance" line carry that weight, because it shreds the premium into confetti and sprinkles it across other categories. Priced at its true share of wallet, this line item alone would move core by half a percentage point or more. When the difference between 2.5% and 3.0% core is the difference between the Fed cutting and holding, that's not a rounding error. That's the ballgame.
Drug prices: the landline problem
Now the -3.1% on prescription drugs. Same playbook: understand what's actually being measured.
The BLS surveys households on which pharmacies they shop at — the CVS on the corner, the grocery-store pharmacy, a mail-order outfit. At each sampled pharmacy, it pulls the last 20 prescriptions dispensed and picks one to follow, with selection odds proportional to each prescription's dollar size. Then it tracks that one prescription's price — the total paid to the pharmacy by patient and insurer — for years. That's the machine.
Two things fall out of that design:
First, entire chunks of the drug market are invisible. Medicaid is excluded entirely (no consumer out-of-pocket payment, no CPI eligibility). And the sampling frame is retail pharmacies — meaning the fast-growing specialty world of biologics, infusions, and clinic-administered drugs largely never enters the index. Specialty drugs are now roughly 55% of all U.S. drug spending — double their share a decade ago — and a 2024 peer-reviewed audit in Health Economics found that missing them has caused the CPI drug index to understate drug inflation by about three-quarters of a percentage point every year.
What if we tried to measure inflation in phone service by only tracking landlines? The methodology would be internally consistent. The data collection would be rigorous. And the answer would be useless, because the market moved and the ruler didn't. That is what the CPI drug index does: carefully measuring the shrinking retail slice of a market whose center of gravity moved to specialty years ago.
Second — the 2026 kicker — legislated price cuts on a handful of giant drugs read as economy-wide deflation. On January 1, Medicare's first ten negotiated drug prices took effect — Eliquis, Xarelto, Jardiance, Januvia, and other heavyweights. Manufacturers slashed list prices to match: per 46brooklyn's WAC data, Eliquis's list price was cut 43% and Jardiance's 44%, effective that same day. These are exactly the high-dollar, high-volume drugs the BLS's dollar-weighted sampling makes most likely to be in the index. One-time statutory cuts, on ten drugs, for one payer — and the index reports "drug prices fell 3.1%."
Did they? We rely on data from our friends at 46brooklyn to answer exactly this question, and the answer depends entirely on which drugs you're standing on. Weighted by utilization dollars, brand list-price growth in 2026 rounds to zero — a few mega-weight drugs took enormous cuts. But the median brand-name drug — the typical prescription's experience — rose 3.7%. And the pre-rebate cost of the average brand claim in Medicaid (a measure that does capture specialty, unlike the CPI) rose from $1,678 to $1,757 — up 4.7%, on its way from $294 in 2012. A six-fold increase in fourteen years, driven by a universe of drugs the CPI has decided doesn't exist.
Run the recalculation. Prescription drugs carry a relative importance of 0.973 — about 1.2% of the core basket. Swap the reported -3.1% for the +3.7% median brand increase and core picks up another ~0.08 points. Stacked on the health insurance fix, today's 2.5% core lands around 2.8%. (Fair warning: our brand measures track list prices and don't net out rebates or generic deflation - which may or may not be passed onto the consumer… so treat this as a directional illustration — which is exactly what the BLS's number deserves to be treated as, too.)
How data becomes bad data
We should say this clearly: CPI isn't inherently bad data. Data isn't born good or bad. CPI measures the thing it was designed to measure.
What makes it bad data is the intent of the people using it. The moment a Fed chair — say, Chairman Kevin Warsh — treats this collection of measurements as "consumer inflation," it becomes bad data. It is being used as a proxy for what Americans feel — and as these two line items prove, it is no such proxy. Worse, decisions get made on that reckless assumption that hurt real Americans. If the Fed leaves rates low because our proxy for inflation looks fine, that can stoke additional real inflation — which, you guessed it, we will probably never measure but will all experience.
Read that last sentence again. Is it any wonder people have lost faith in our institutions? We use models designed to tell us everything is OK when it clearly is not, and neglect to tune them to reality.
Maybe that's why this infuriates me so much. My first job out of undergrad was at ExxonMobil, tuning refinery models to the reality of that refinery. At Exxon, we didn't have the luxury of living on a merry-go-round where broken models could be treated as real because enough rich and powerful people believed them. If the model was wrong, Exxon lost money in the best case. Things blew up in the worst case. So we made sure our models measured, as closely as possible, what they were built to measure.
The BLS doesn't operate with those stakes. And don't blame the economists and statisticians producing these numbers — the methodology documents we quoted are their disclosures; they're not hiding the ball. Blame our leadership for (1) waving these numbers around as propaganda and policy, and (2) never demanding we improve them to reflect the reality of real Americans.
And understand this: leaving the model broken is not inaction. It is a decision — made budget cycle after budget cycle — to keep propagating the problem. We have the technology today to measure these things more accurately than at any point in human history. The government, the same one holding a printing press, has every resource it needs to get the data. If one guy in Ohio can recast the most egregious offenders in CPI in a couple of hours, surely the government could fix its own broken model. Which brings us to the real question: does it want to? Does it really want to know the inflation we are actually experiencing?
Let me be crystal clear about what this piece is and isn't arguing. Do I have my own view on where rates should go? Sure. Anyone who stares at this data long enough does, and mine comes from my read of it. But that's my opinion, and this piece isn't about my opinion. Data 4 The People's job here is to expose the measurement problem — because you deserve to come to your own conclusions about rates, and about everything else. None of us can do that with measurements and models that don't genuinely try to measure reality. You cannot make a good decision — in any direction — with a ruler that doesn't measure what you think it measures. A pilot doesn't want the altimeter to read higher or lower. A pilot wants the altimeter to work.
Our models say health care got cheaper this year. Ask anyone who pays a premium, meets a deductible, or fills a prescription whether they believe that. Then ask why the people setting interest rates for the entire economy apparently do.
Sources
- BLS, Measuring Price Change in the CPI: Medical care (factsheet, last modified 2/13/2026) — retained earnings method, NAIC data sourcing and ~10-month lag, Rx sampling (last-20 PPS), Medicaid/workers'-comp exclusion, relative importances (health insurance 0.890, prescription drugs 0.973, Dec 2025). bls.gov/cpi/factsheets/medical-care.htm
- BLS, Improvements to the CPI Health Insurance Index — 2023 methodology change, two-year smoothing, semiannual updates.
- KFF, 2025 Employer Health Benefits Survey — family premium $26,993 (+6%); worker contribution $6,850 (vs. $6,296 in 2024); single deductible $1,886 (vs. $1,773).
- KFF ACA Marketplace analyses (2026) — enrollment/premiums/deductibles analysis; Peterson-KFF 2026 rate brief — 26% average premium increase (30% Healthcare.gov / 17% state-based); net enrollee payment $113→$178/mo (+58%); ~$1,000 deductible growth; subsidized share 92%→87%.
- KFF / MedPAC — Part D: MA-PD drug deductible $64 (2024) → $228 (2025) → $371 (2026); stabilization demonstration subsidies ($26/mo 2025, $16/mo 2026, ~$9.8B); demo ending after 2026.
- Milliman, Analysis of Part D beneficiary out-of-pocket spending (Oct 2025, CMS claims data) — NLI OOP $260 (1H2023) → $245 (1H2025) while gross costs rose 28%.
- BLS Consumer Expenditure Survey (2024) — health insurance $4,055 of $78,535 average annual expenditures = 5.2% of household spending (healthcare total $6,197 / 7.9%).
- NAIC, U.S. Health Insurance Industry Analysis Reports (2025 mid-year and annual) — the exact data source feeding the CPI health insurance index: industry profit margin 1.8% at mid-2025 vs. 2.7% mid-2024; full-year 2025 margin 0.4% vs. 0.8%; $8.1B net underwriting loss (-526.7% YoY); hospital/medical expenses +14.8% ($155B). Retained earnings collapsed in exactly the periods now feeding the index.
- Hicks et al., Auditing the prescription drug consumer price index in a changing marketplace, Health Economics (2024) — specialty ≈ 55% of drug spend; ~75bp/yr understatement from missing non-retail specialty.
- CMS — first 10 Medicare negotiated prices (MFPs) effective January 1, 2026.
- 46brooklyn Research, Brand Drug Box Score — Stat Boxes #3, #4, #6 (median brand WAC +3.7% in 2026; utilization-weighted ≈ 0%; Medicaid pre-rebate brand cost/claim $294 → $1,757).
Support Data That Serves the Public
Data should empower people, not just institutions. Your support helps us create accessible research, visualizations, and tools that uncover economic inequality and inform better decisions.
Donate
Enjoying this post?
Tell others about it.
More articles like this
Fetching Related Posts
There are no other articles tagged with Data 4 Thought