
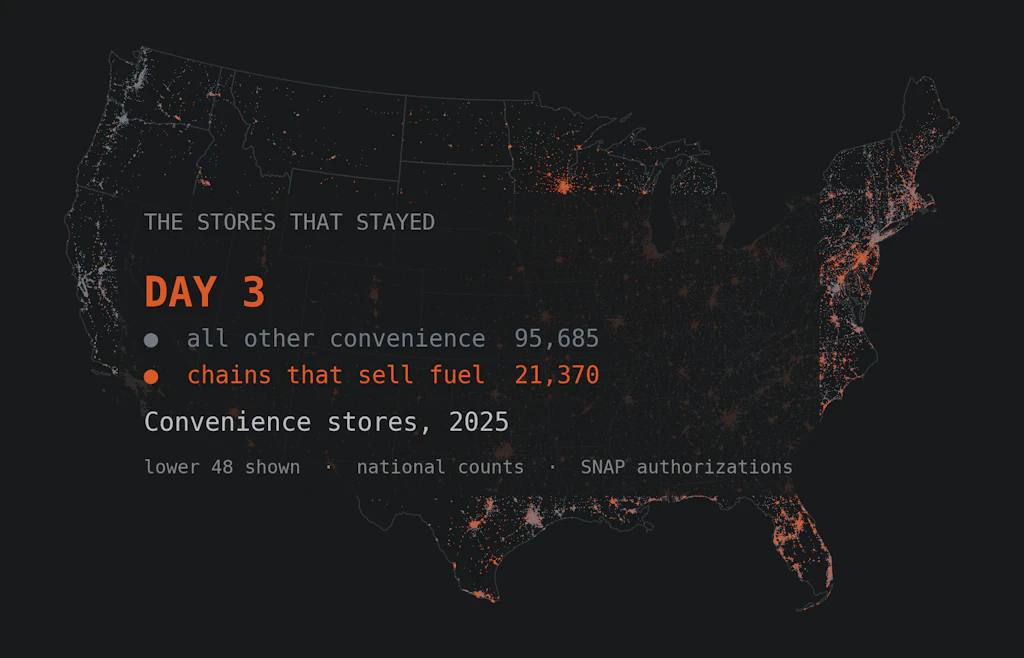
Convenience stores and the advantage hiding in plain sight
The convenience store looks like the format that beat the odds — more stores than any other in SNAP, still growing, and mostly independent. Split it open and the winners are the fuel-selling chains, riding a pump margin that doubled after 2020 and never came back down.

Eric Pachman
Published
August 21st 2026
SNAP-authorized retailers, 2006–2025. EIA weekly gasoline prices. Retail fuel margins from Murphy USA and Casey's 10-K filings. 346,974 convenience stores in the file.
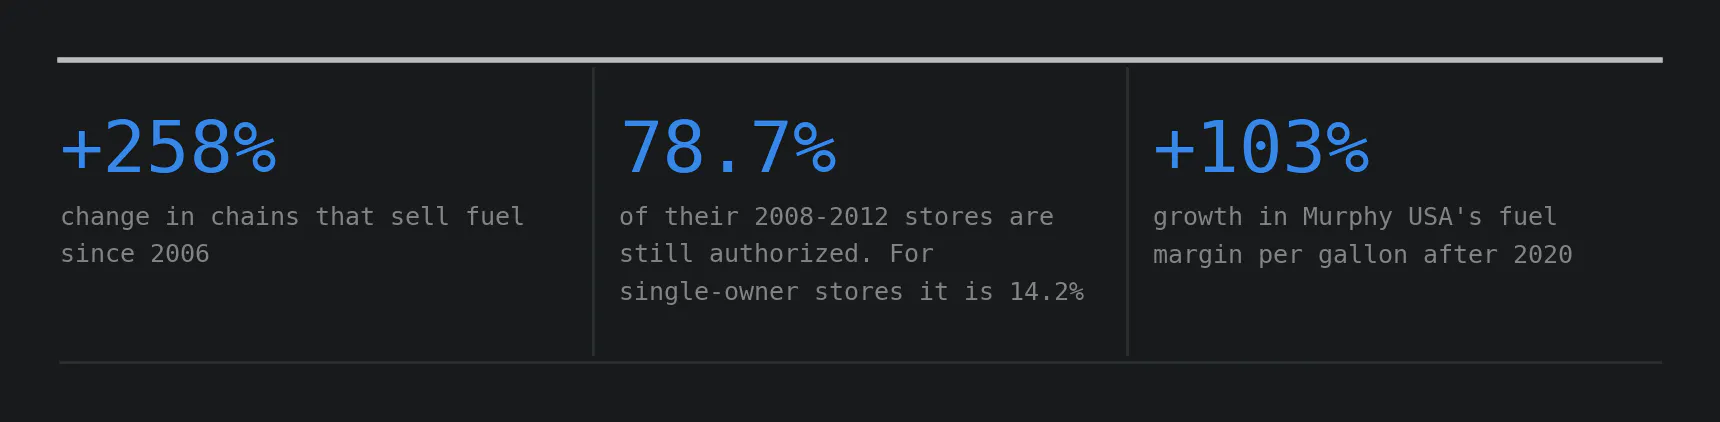
+258% change in chains that sell fuel since 2006. 78.7% of their 2008–2012 stores are still authorized. For single-owner stores it is 14.2%. +103% growth in Murphy USA's fuel margin per gallon after 2020.
Yesterday ended on a puzzle. Dollar stores thrived because they are chains. Convenience stores are the opposite: only about a third belong to a chain, and there are more of them than any other kind of SNAP retailer. If you read the last two days of analysis, you may have expected them to go the way of the small grocer.
They did not. But the reason has less to do with ownership, and more to do with an advantage few other store formats had.
One store format masks different growth trends
The convenience store format is enormous. There are 117,055 stores authorized to accept SNAP benefits today, far surpassing any other store format. That makes sense: it is not uncommon to see a gas station at every major intersection.
But we cannot analyze the convenience store format as one thing, because within it live very different kinds of stores, and they grew at very different rates. There are chains that sell fuel — Wawa, Sheetz, Casey's, QuikTrip and the like — which surged 258% between 2006 and 2025. There are chains that are not built around fuel — 7-Eleven, above all — which grew 163%. And there are single-owner stores, which make up most of the category and grew 60%.
The chart below shows the growth of each, compared with the dollar store, indexed to 100 in 2006. Only one comes close to matching the dollar store: the chains that sell fuel.
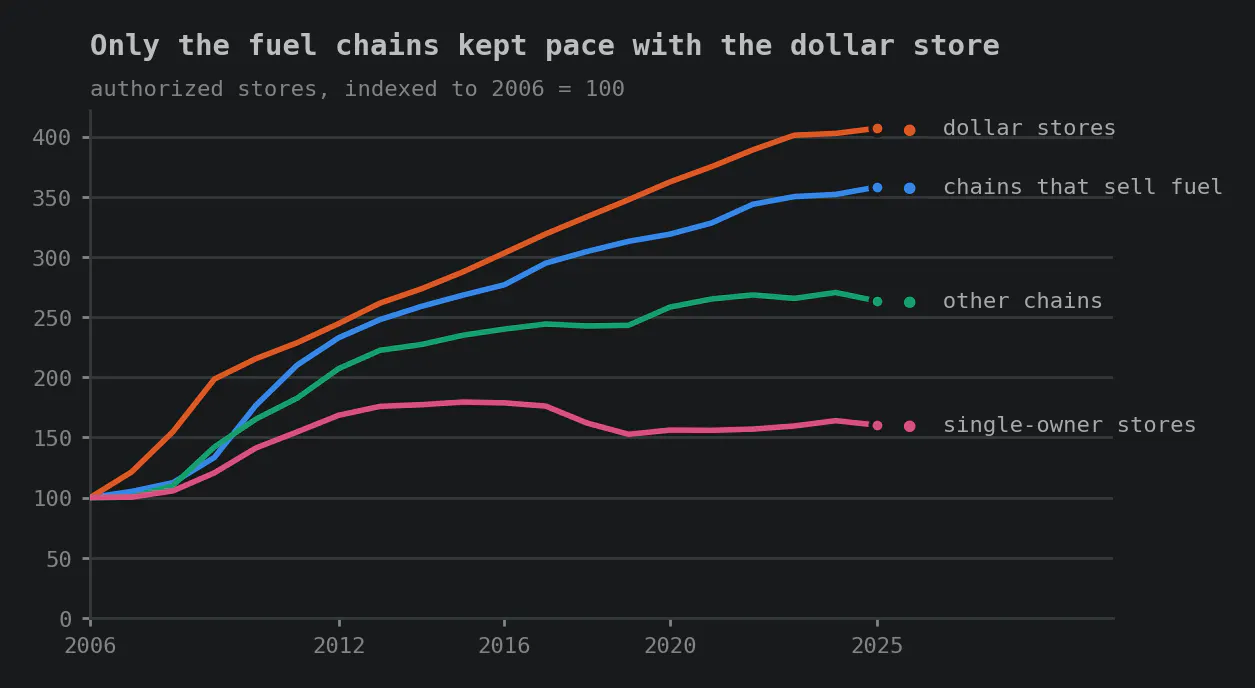
The fuel chains went from 9.8% of the category to 18.3%.
The fuel advantage
There is something else you need to know about this format, and it has nothing to do with what is on the shelves. After 2020, selling fuel became far more profitable.
Two of these chains are public companies and report their fuel margin in cents per gallon.
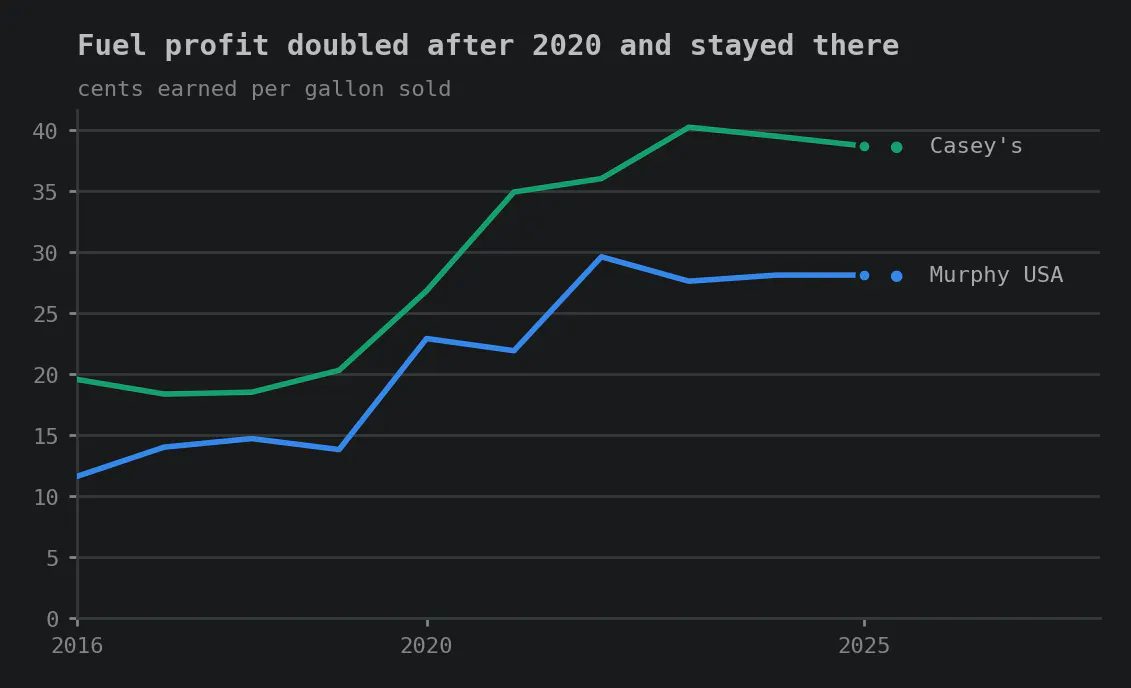
Murphy USA earned 13.32 cents a gallon before 2020 and 27.06 after. Casey's went from 19.18 to 38.64. Both roughly doubled. Before 2020 Murphy's margin never left the 11.6 to 14.7 cent band. Since 2021 it has never dropped below 21.9. The two ranges do not overlap at all.
A check, because a doubling is a big claim. Take what drivers pay at the pump and subtract the wholesale price at the New York Harbor trading hub. That gap widened by 14.9 cents between 2015–2019 and 2021–2025. Murphy's own margin grew 13.7 cents. Those are nearly the same number, which tells you where the money most likely went: taxes and shipping did not absorb it. It appears that almost all of it became store profit.
Why it happened is worth pondering. Note that this is our hypothesis. But we have poked at it using the data, and it seems to hold. It also jibes with our lived experience, which should not be discounted.
When COVID stopped people driving, fuel volume and store traffic fell together — Casey's reported same-store gallons down 8.1% and inside customer traffic down 8.7%. With fewer customers coming through, the fuel had to earn more from each one. Margins rose.
What nobody expected is that fuel margins stayed there. Customers came back. Margins did not fall. Casey's now tells its investors it expects them to “remain elevated from historical levels for the foreseeable future”. Murphy is still selling about 5% fewer gallons per store than in 2019 — and earning twice as much on each one.
So, post-COVID fuel margins are the advantage we have been teasing throughout this post. File that knowledge away as we turn back to the topic at hand — SNAP authorizations.
The format thrives, but are all owners realizing the benefit?
Everything so far has been about the chains. What about the much larger group of single-owner stores?
On the surface they look fine. They added about 28,735 authorizations over the same nineteen years, growth of 60%. Slower than the chains, but a category adding that many stores is not a category in trouble.
The difference only shows up when you stop counting stores and start asking whether they are the same stores.
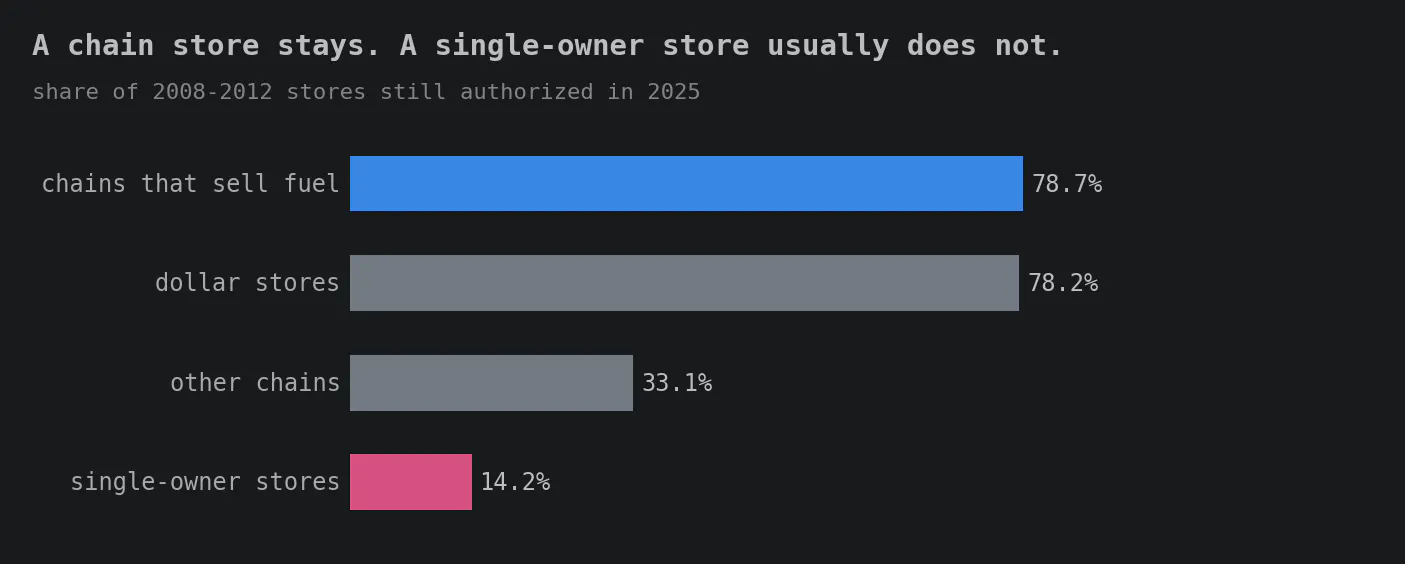
Take every store authorized between 2008 and 2012 and ask how many are still authorized thirteen years later. For chains that sell fuel it is 78.7% — the same rate as dollar stores, which is the benchmark from yesterday. For single-owner stores it is 14.2%.
It would be easy to read that as a wave of closures. It is not, and the check matters. The Census Bureau counts business locations whether or not they take EBT. Between 2012 and 2023 convenience establishments rose +6.4%. The under-ten-staff slice — the cut we used for grocers — slipped 4.6%, while the very smallest stores, under five staff, rose +9.7%.
So the corner store is not disappearing. What is more likely happening is that the specific business or owner in the building keeps changing. A store is sold, renamed, re-registered, and a new record appears. The storefront stays. The owner turns over.
That is the difference between a chain and a single owner. A chain compounds: whatever it built twenty years ago, it largely still has, and it adds to it. A single-owner site is likely churning — handing the keys to the next person. Same storefront, same shelves, new name on the paperwork — and in this data, a new record starting from scratch.
What it adds up to
Drilling into this format does not give a new answer. It reinforces the same takeaway.
Small grocers are disadvantaged because they are small and alone. Dollar stores are advantaged because they are small and part of a massive chain. Convenience stores split along exactly that line: the fuel-selling chains kept 78.7% of their stores over thirteen years, the single owners only kept 14.2%.
So think of that Wawa or Sheetz going up on the corner near you as something close to a dollar store with one extra advantage: a fuel margin that doubled after 2020 and never came back. Same small footprint, same chain economics, plus a second profit stream that got far more profitable.
For a household with an EBT card, the practical result is the same either way. In a small town, the gravitational pull of grocery economics is leaving them two options: a dollar store and a gas station. Both are now cheap to run, both can be profitable at smaller volume. Unfortunately, neither was designed to sell the week of groceries assumed by the government's Thrifty Food Plan.
But that is today. The million-dollar question is what happens to SNAP authorizations for these fuel convenience stores when the new stocking rule takes effect in a few short months, raising the number of staple items required on the shelf from 36 to 84. We will explore this in more depth in the closing post of this series, but for now we can see a few options for the gas station convenience stores:
- They can drop SNAP, further limiting food access for our nation's most vulnerable population.
- They can comply and eat the cost, sacrificing profits (not likely).
- Or they can comply and pass the cost on at the pump — where margins have already doubled once this decade.
Note that if we head down path 3 — which any profit-maximizing business owner should be expected to choose — they will be doing it in the middle of what is, in our view, a fuel crisis of a magnitude we have not seen since 1973.
Another lesson in the law of unintended consequences.
Next week: we turn our attention to the larger store formats.
Support Data That Serves the Public
Data should empower people, not just institutions. Your support helps us create accessible research, visualizations, and tools that uncover economic inequality and inform better decisions.
Donate
Enjoying this post?
Tell others about it.
More articles like this
Fetching Related Posts
There are no other articles tagged with Data 4 Thought