
The Grid Is Quietly Tilting Back to Gas
A simple question about where renewable energy lives led somewhere I didn't expect, and to a harder question about who's really steering.

Eric Pachman
Published
June 17th 2026
Back To The Future
Today's Data 4 Thought is an exciting one for me. Not because of the content. Don't get me wrong, I think the content is great. It came from my own curiosity, so of course I'm going to like it. But it was the process that was so exciting.
Today's post represents the core intent of Data 4 Thought. Start with an idea. Use data to explore it. Arrive at a completely different, far more interesting story I had no idea existed. Tell that story. Set it aside. Think. Let it grow branches in multiple directions. Follow the most interesting one. And eventually, write it all up. It was a beautiful process that unfolded off and on yesterday, and it resulted in this piece.
Another reason I get excited about showing the process is that Data 4 The People is working to build tools to make it easier for everyone to do exactly this. We plan to create a structured, safe, AI-powered workspace for this kind of data exploration. The goal is not to provide answers. It's to spur critical thinking, rooted in facts and truth you can trust.
So, what is Data 4 Thought? At its best, it's just a series of examples of this process. It's not perfect, because I am not perfect. It's biased at times, because I have biases, just like you. But it's honest, vulnerable, rooted in data, and like an anthropologist's field notes, it catalogues my learning of the world and the broadening of my worldview.
That said, let's dive in.
Yesterday morning I woke up wondering about the mismatch between where renewable energy is generated (solar, wind) and where energy is actually consumed in the U.S. Despite this being well researched and covered in the media, I thought it could make for a good Data 4 Thought piece, since I don't think this mismatch is common knowledge.
So I started researching, and stumbled onto a far more interesting story. It comes from a dataset that, admittedly, was new to me: the "Queued Up" report, published by Lawrence Berkeley National Laboratory (LBNL). It's the definitive source on U.S. electric grid interconnection queues.
That's a mouthful, so let me explain my understanding of it in plain English. Say a developer wants to build new generation, maybe to serve a slate of new data centers that need power. Before that generation can plug into the grid, it has to get in line. The developer files a request, and the grid operator works out whether the grid can actually absorb the new power, and what upgrades it would take to carry it to where it's needed. That line is the interconnection queue. Every project sits in it tagged by what kind of power it is, solar, wind, gas, and waits, often for years, while the studies grind on.
Clear as mud?
Maybe this chart will help. It shows the capacity sitting in the queue at the end of each year. As you can see, it's overwhelmingly been renewables. That makes sense, because until recently there were large federal incentives pushing developers to prioritize renewable energy over fossil fuels. And recently, you can see the trend has turned. Capacity in the queue is now declining.
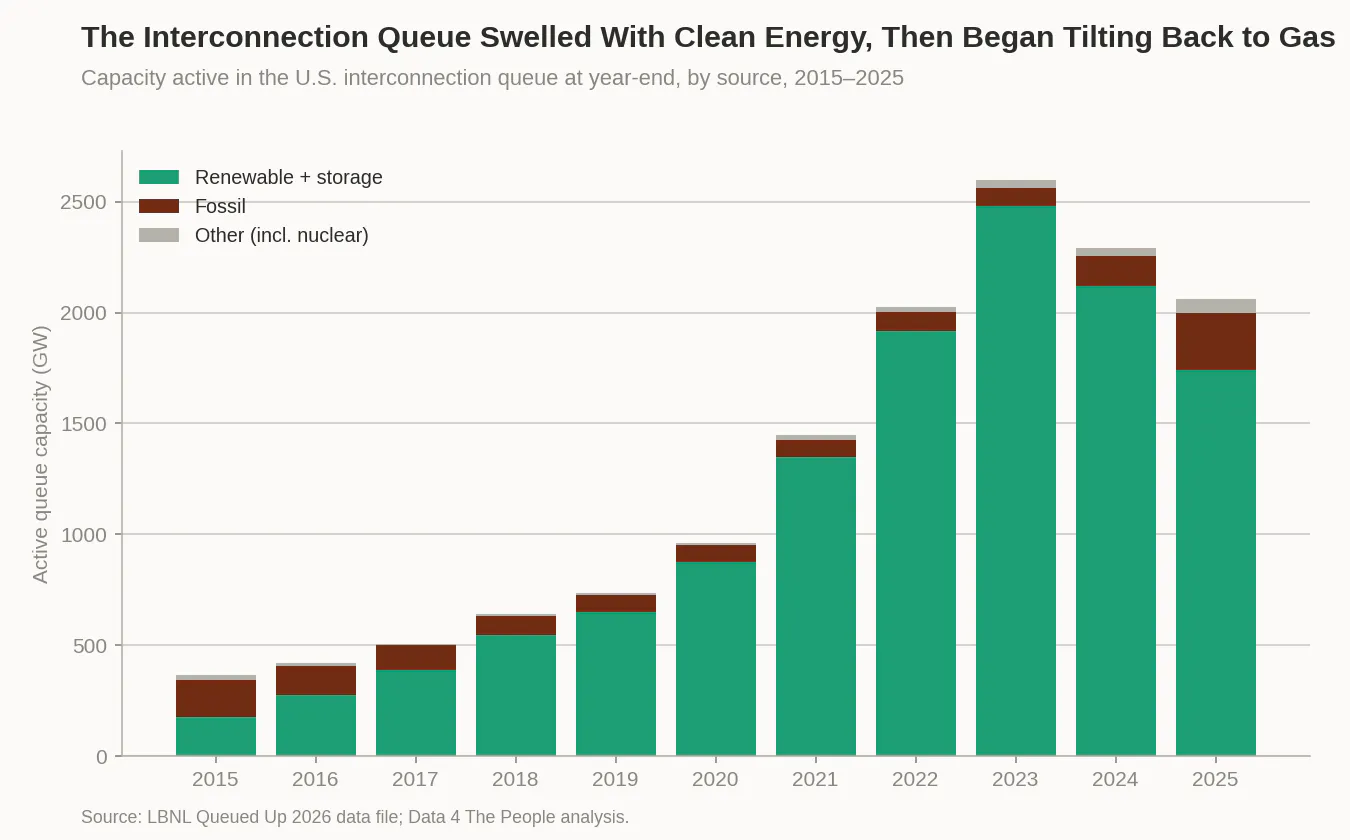
No matter how tempting it is, don't jump to conclusions about why it's dropping. Yes, the One Big Beautiful Bill kneecapped many of the renewable subsidies that had been in place for years. But in digging into this data, we found that withdrawals are extremely common. In fact, roughly 80% of all the capacity that has entered the queue eventually gets withdrawn rather than built. So what appears to have happened is that the queue got stuffed through 2023 with all sorts of renewable projects, and then a large share of them got withdrawn. The chart below confirms it.
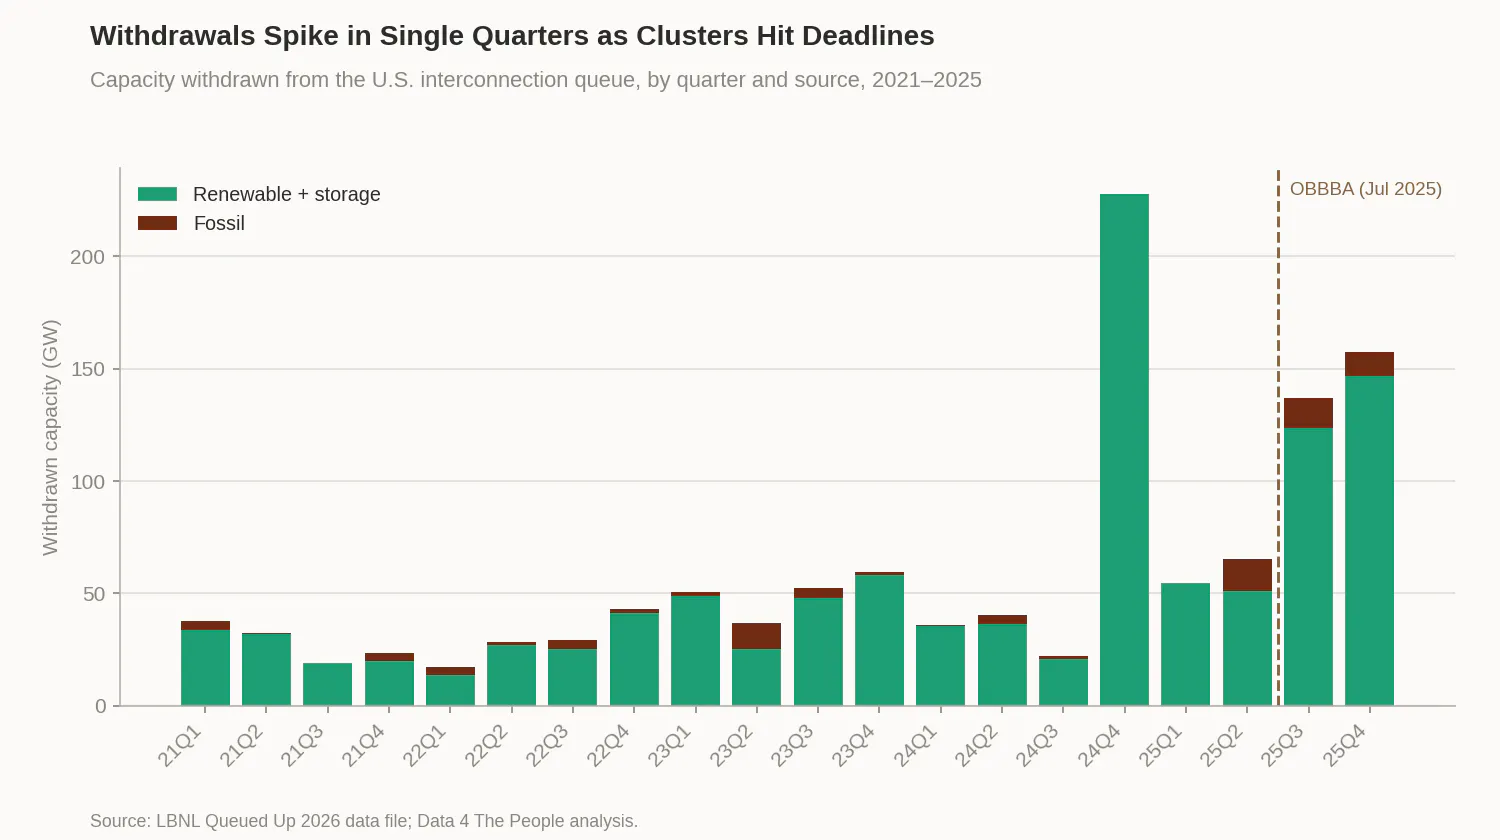
You can see the huge jump in withdrawals in Q4 2024. Digging in, this looks like an administrative cleanup more than anything else. In 2023, federal regulators (FERC) overhauled how the queue works, replacing the old first-come-first-served process with a system that studies projects in grouped "clusters" and, crucially, charges developers real money to hold their place: sizable deposits scaled to a project's connection costs, plus penalties for backing out once the process is underway. Under the old rules, parking a speculative project in the queue cost almost nothing, so developers filed widely and let projects sit. Once holding a spot started carrying a real cost, developers culled the projects they were never seriously going to build. Much of the Q4 2024 spike is that culling.
But this isn't all administrative cleanup. Look at the quarters after OBBBA. The renewable queue keeps draining at a rapid pace.
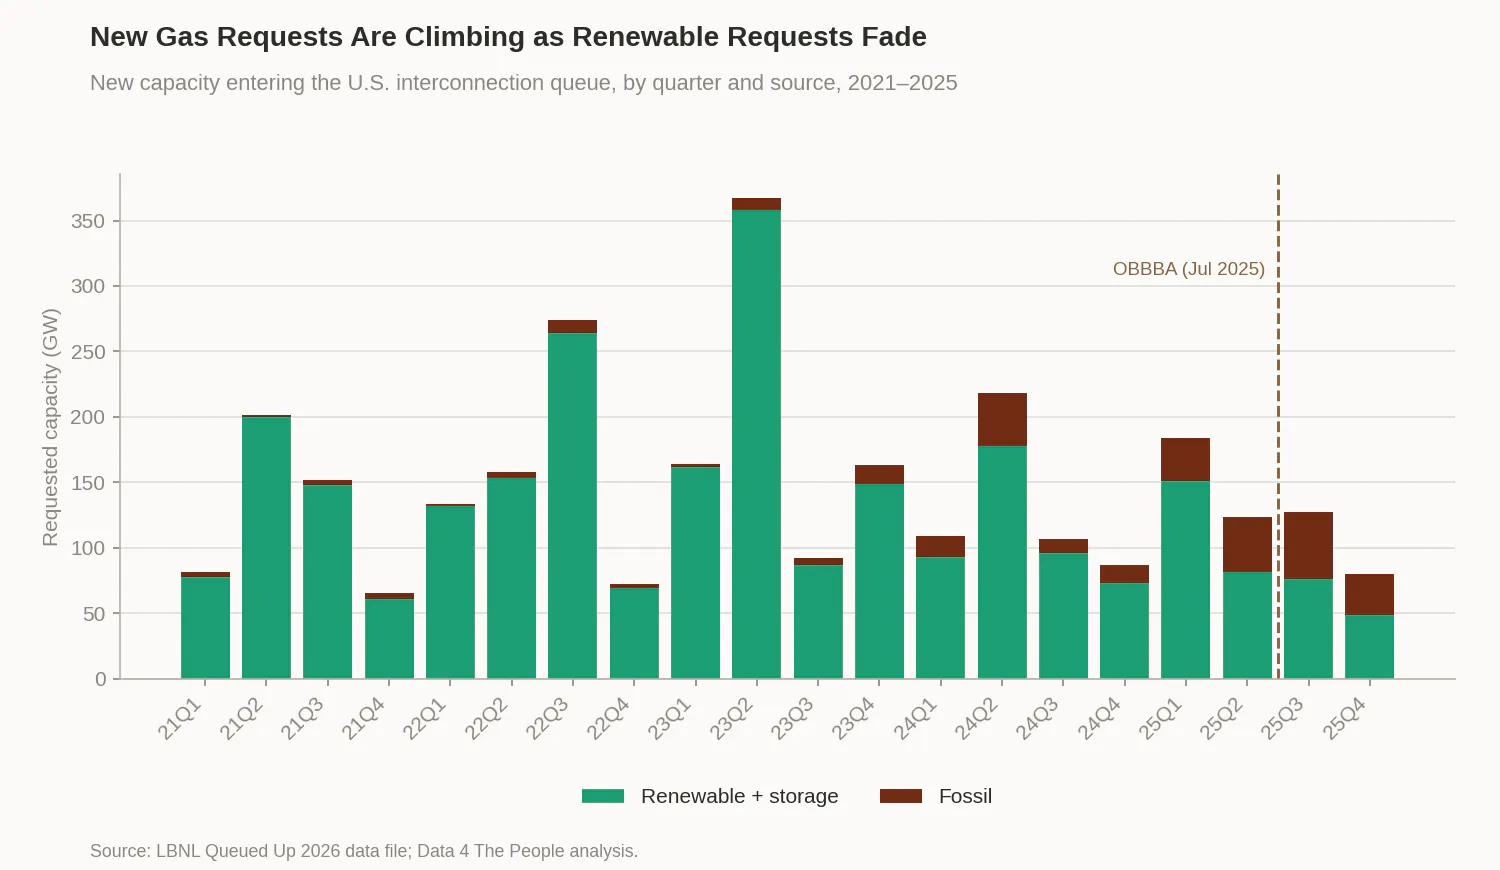
For more evidence, look at the next chart, which shows the new interconnection requests added each quarter. Look at how many are fossil fuels. It's back to the future. After years of almost no new fossil fuel requests, they're surging again. In 2024 and 2025 there were more interconnection requests for fossil fuel capacity than in the prior six years combined.
With AI's help, analyzing the data and working out what happened, what we know, and what we don't, is the easy part. About an hour of work, maybe.
But what differentiates us from AI is that we can, if we choose to, do the hard work afterward. We can form hypotheses that get at the root cause of a problem.
For me, watching the surge in renewable interconnection requests stall and get replaced by a surge in fossil fuel requests was the symptom of a larger problem, one that cuts to the heart of how our political system is designed. American politics, especially at the federal level, has devolved into one endless campaign cycle. Yes, there may be a couple of years where policy actually gets done, but only when the stars align and one party controls both houses and the presidency. And in my view, even then the policy is often oversold. It doesn't always deliver the benefits that were promised, and often carries unintended consequences that no one campaigned on. And whatever does pass gets reversed or undermined by the other side a few years later. We're on a hamster wheel as a country, going in circles, preventing the government from carrying out any long-term structural change for the public good (say, weaning ourselves off fossil fuels). Thankfully the interstate highway system was built in a different era, because that kind of undertaking would never survive today's political climate.
So here is this data, showing the push and pull with renewables. We provide incentives, then we pull them. We ask utilities and developers to spend money based on one set of rules ("renewables are good"), then we change the rules ("renewables are bad"). The process is horribly inefficient, costly, and gets us nowhere.
Contrast that with China's command-and-control approach to its economy. If the powers that be decide to drive solar cell costs toward zero, they do it. If they decide they want affordable EVs in every driveway, they invest until it happens. If they decide to streamline their rare earths industry, they shut down unsafe mines and force consolidation.
I want to be honest that I sit with this contrast a lot, and I don't have it resolved. We could never run that system here, and we shouldn't try. We are night-and-day different culturally. China was, for a generation, famously run by engineers; we have never been. There are a dozen other reasons it wouldn't translate, and that level of control is genuinely frightening in the wrong hands (we are getting our own look at what unchecked power can become). So no, I am not advocating for it.
But I can't bring myself to simply villainize that kind of direction either. Because here is the uncomfortable other side: when the government sets no course at all, or keeps reversing the one it sets, it doesn't mean no one is steering. It means the market steers. And the market does not make decisions for the people. It makes them for the people with the money to invest. Consider that the ten largest companies now account for roughly 40% of the entire S&P 500, an all-time high, with a handful of big tech names alone making up about a third of it, up from around 12% a decade ago. That is what the steering wheel actually looks like. A few enormous firms, and the capital flowing into them, increasingly set the direction. A government that flip-flops every four years isn't protecting us from concentrated power. It's just ceding the wheel to whoever holds the most capital, with none of the accountability. So I find myself asking: if a government not only sets no course, but keeps reversing course, how much less dangerous is that, really?
I don't have the answers. It's the question itself, and the path I took to reach it from a starting point that had nothing to do with it, that I am trying to illustrate today. This is Data 4 Thought at its finest. It opened my mind to existential questions I now realize sit at the root of my thinking. If we all had better tools to do this, and then to discuss and debate what we found, how much stronger could our democracy be?
Support Data That Serves the Public
Data should empower people, not just institutions. Your support helps us create accessible research, visualizations, and tools that uncover economic inequality and inform better decisions.
Donate
Enjoying this post?
Tell others about it.
More articles like this
Fetching Related Posts
There are no other articles tagged with Data 4 Thought