
1.4 Million Workers Disappeared From the Data. Unemployment Didn't Move.
Nobody lost a job. The government fixed its population model, and America came out older than the data said.

Eric Pachman
Published
July 10th 2026
America is Older Than the Data Said.
Earlier this year, the government changed how it counts Americans
It was not a secret. The Census Bureau published it. The Bureau of Labor Statistics explained it, in its own jobs report and in a technical document. And almost nobody noticed.
But it matters. A lot. Here is why.
We understand America through models.
We cannot count every person in this country every day. So we build models. We count everyone once a decade, and in between, we estimate. Births, deaths, people arriving, people leaving. The model fills the gaps.
And these models run everything. How much a family gets in SNAP benefits? A model. Medicaid funding? A model. The unemployment rate you hear every month? Built on a model of how many people are out there to begin with.
We have written a lot about the problems with these models. But we are not here to throw stones. There is an old saying among statisticians: all models are wrong, but some are useful. That is the most honest sentence ever written about this work. The people who build these models know they are wrong. Their job is to keep making them less wrong.
That is what happened this year. The Census Bureau updated its model of who lives in America. For years, the model used to combined the 2020 Census headcount with age and race details borrowed from other sources. The new version uses the census's own details instead. A fix. An improvement. The model got more useful.
We already told you one thing the improved model revealed: America is more multiracial than the old numbers showed.
Today we are telling you the second thing. America is older than the old numbers showed.
What the fix changed
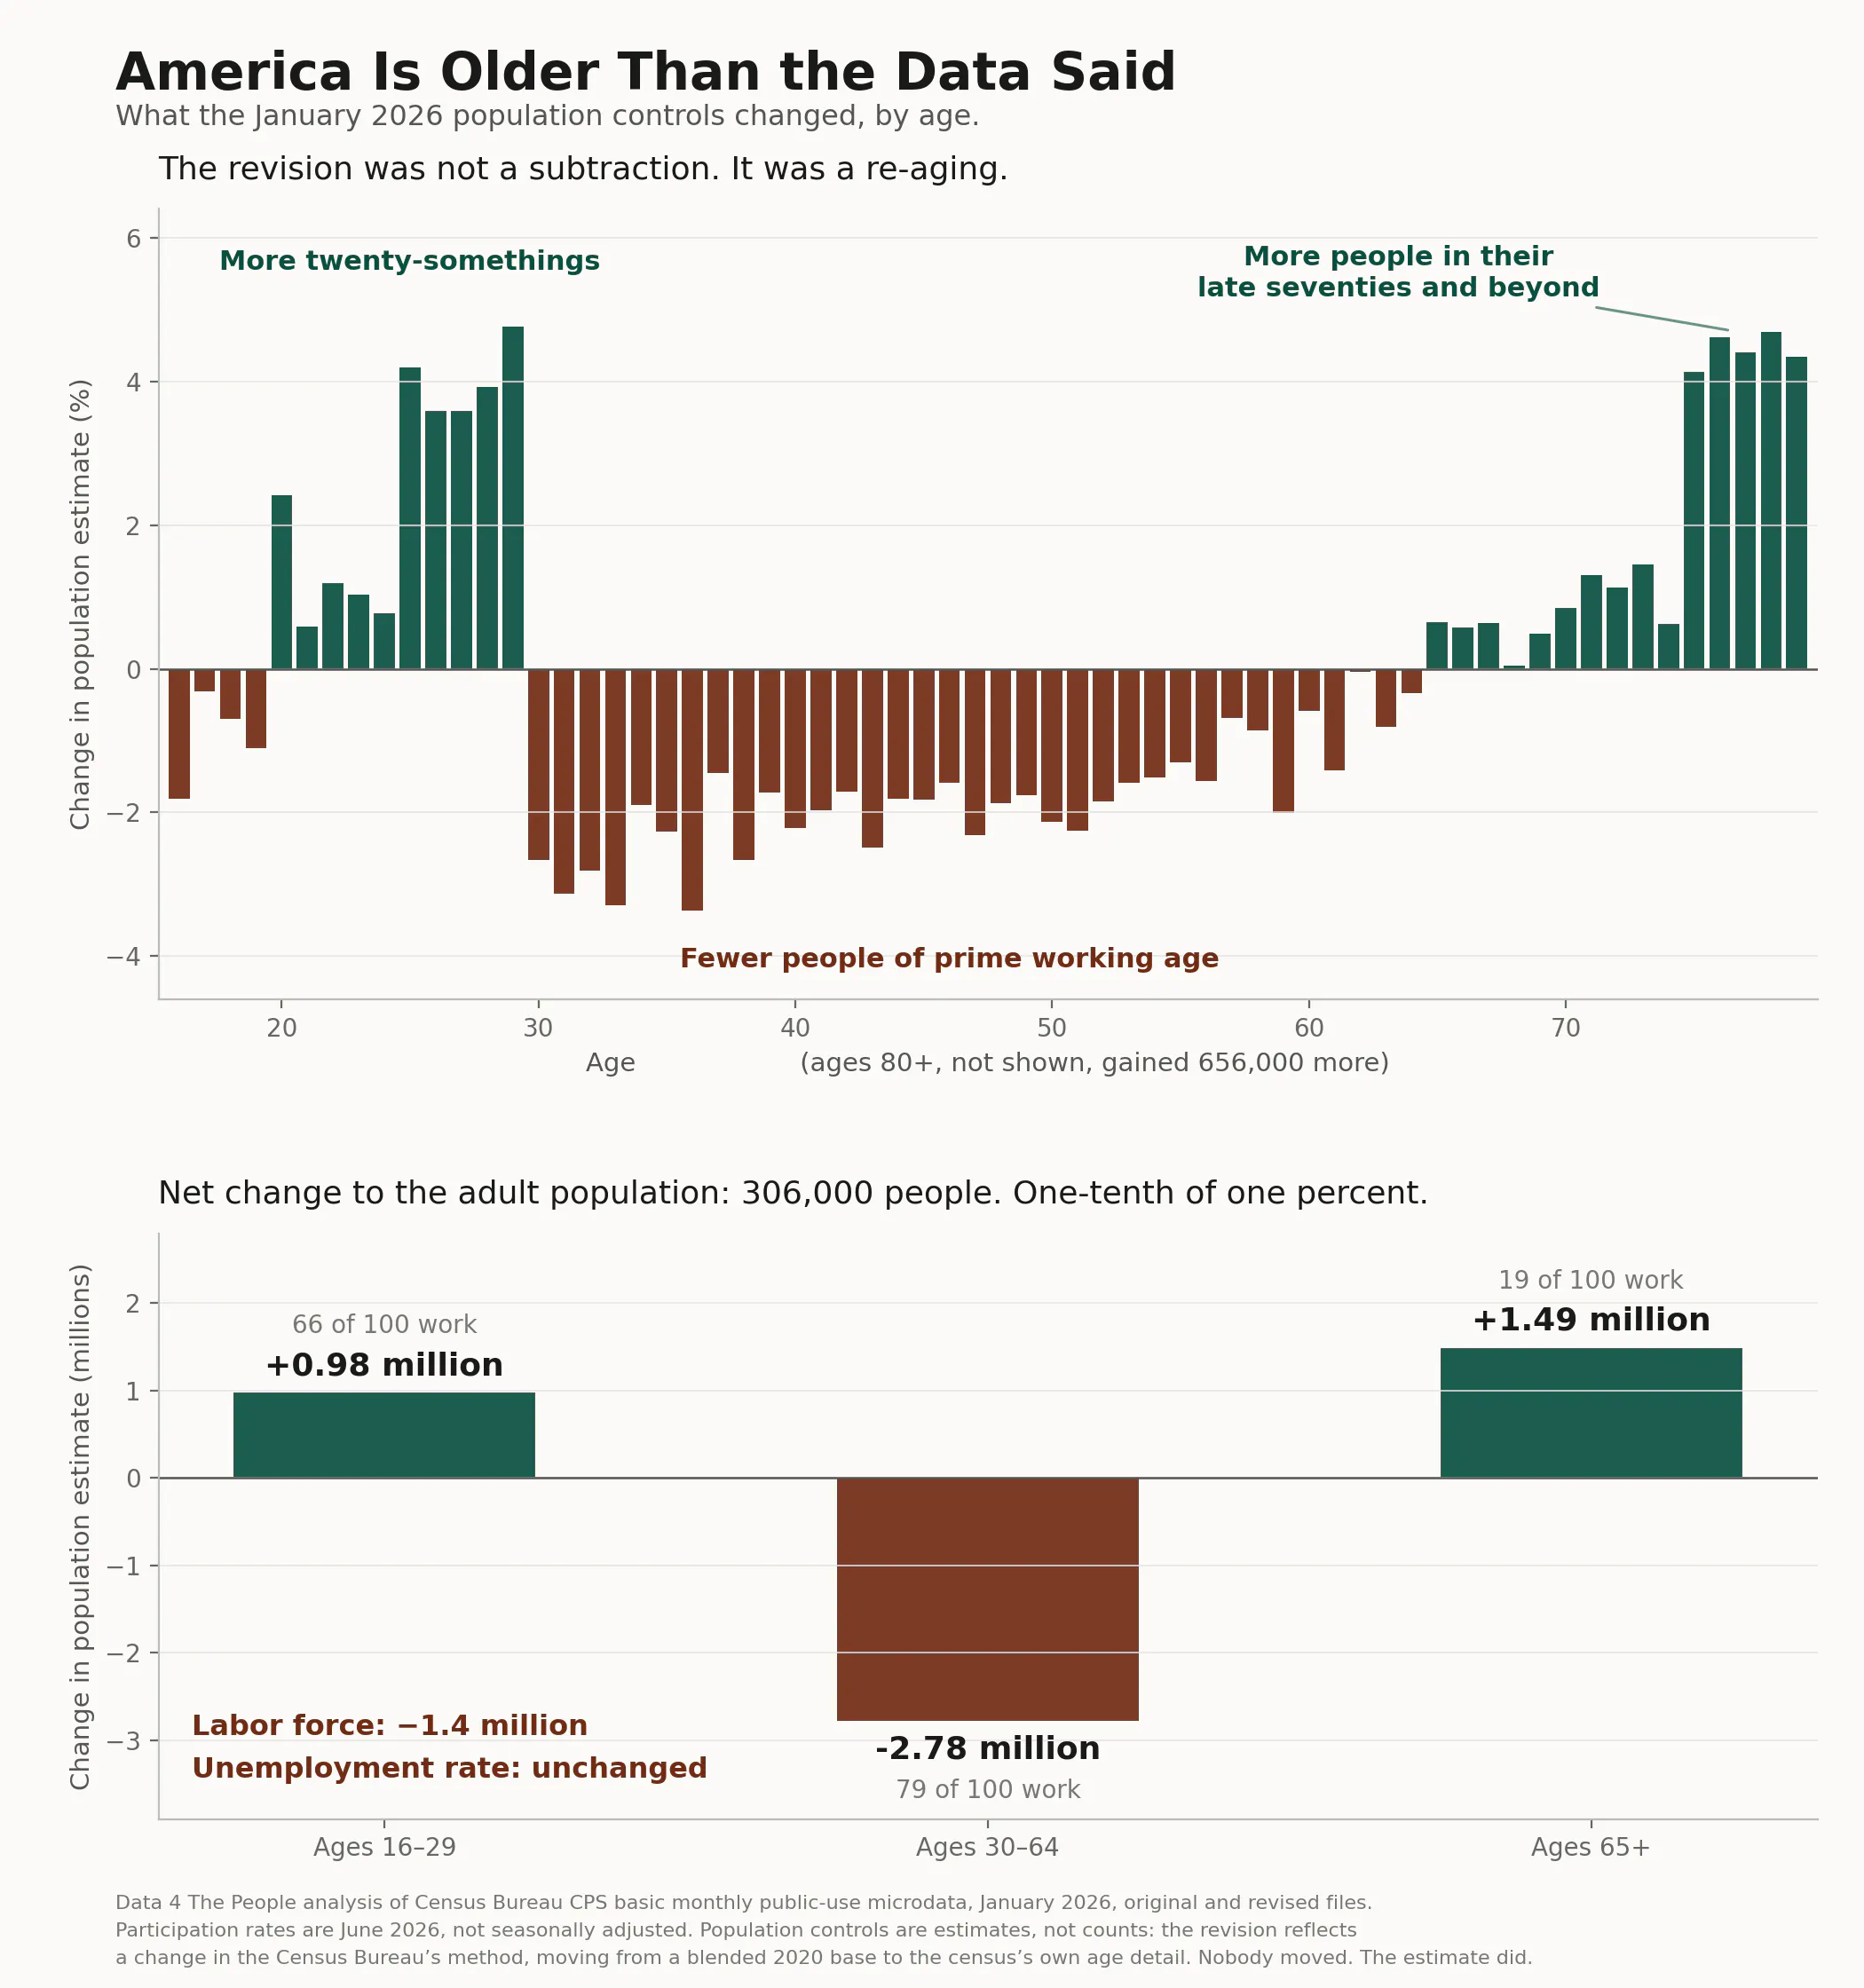
Here is the strange part. The total barely moved. The new model counts about 306,000 fewer adults than the old one. Out of 275 million people, that is one-tenth of one percent. A rounding error.
But look under the total, and millions of people moved.
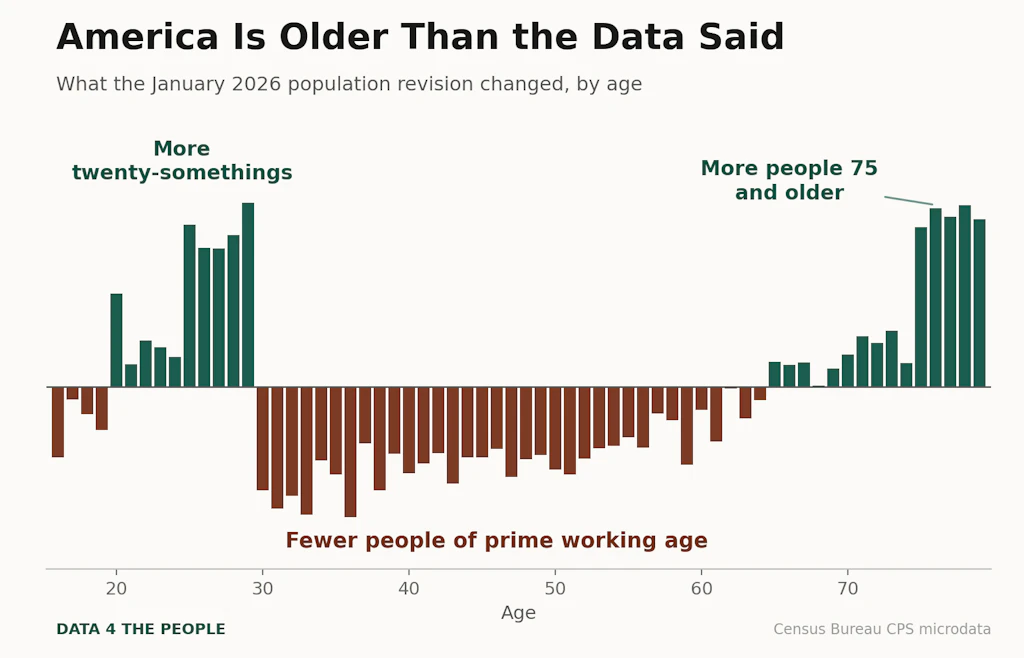
The new model says we have 2.78 million fewer people between the ages of 30 and 64 than we thought. It says we have 1.49 million more people 65 and older. More than 1.2 million of those are 75 or older.
It also found about a million more people in their twenties. Hold onto that. It matters in a minute.
Nobody actually moved. Nobody got older overnight. Nobody left the country. The people are the same people they were in December. What changed is our picture of them. And the picture now says: older.
Why one-tenth of one percent matters
Because age is everything when it comes to work.
Out of every 100 Americans between 30 and 64, about 79 have a job or are looking for one. Out of every 100 Americans 75 and older, about 9 do.
So when the model moved millions of people from the first group to the second, the count of American workers fell with them. The labor force, the official count of everyone working or looking for work, dropped by 1.4 million people. In one revision. Five years of the model drifting from reality, corrected in a single day.
Even the million extra young people the model found could not offset it. They work at high rates too, and they added workers back. It still was not close to enough.
And here is the part that should stop you: the unemployment rate did not move.Not by a tenth of a point. Because nobody lost a job. The model simply decided that 1.4 million of the workers it used to count were never there, and that a million-plus retirees it used to miss always were.
The most-watched number in American economics stayed perfectly still while the ground under it shifted by millions of people.
Why you should care
Workers are the engine of this country.
Workers pay income taxes. Workers pay into Social Security with every paycheck. Workers fund Medicare. America's whole design depends on people in their working years paying into a system that supports people past theirs.
Every plan for that system, every Social Security projection, every Medicare forecast, every estimate of what the government can afford, was built on the old model's count of working-age Americans.
We just learned that count was too high. By millions.
Here is the part worth sitting with. For over a year now, economists have been bracing for a big, scary revision to the payroll numbers, proof that America has not been creating as many jobs as the headlines said. We are among those people. We have written about it.
But while everyone watched that door, a different revision walked through another one. This one did not change how many jobs America created. It changed how many workers America has. And that is the scarier number. A bad jobs month is a bad month. A smaller workforce is the ceiling on every month after it.
The aging of America is not news. We have written about it. Many others have. What is news is this: it is further along than the official numbers said. The old model was not capturing how old America already is. The new one does. And the moment it did, several million working-age Americans, and the taxes they were projected to pay, turned out to be an estimate that had been wrong for years.
One honest caution before we close. We can show what the model changed. We cannot show which version was closer to the truth. The new count is the Census Bureau's best estimate, not a recount. Models get less wrong. They do not get right.
But the best estimate we have now says what it says.
The people were always this old. We just found out.
Methodology notes
Data 4 The People analysis of Census Bureau Current Population Survey basic monthly public-use microdata, January 2026. We compared the original January 2026 file (weighted with Vintage 2024 population controls, as used in the January Employment Situation) against the revised January 2026 file released March 11, 2026 (weighted with Vintage 2025 controls). Both files contain the identical 74,510 person records; only the weights differ. Composited final weights (PWCMPWGT).
Our totals reproduce BLS's published figures: labor force change of -1.42 million (BLS: -1.4 million), employment -1.42 million (BLS: -1.4 million), participation rate -0.45 percentage point (BLS: -0.4), unemployment rate unchanged (BLS: unchanged). BLS figures from "Adjustments to Household Survey Population Estimates in January 2026," CPS Technical Documentation, March 2026, and The Employment Situation, February 2026 (released March 6, 2026).
BLS's supplemental table of 2026 population adjustment effects (XLSX, CPS Technical Documentation) provides the adjustment's effects by sex, race, Hispanic ethnicity, reason for and duration of unemployment, class of worker, and full- or part-time status. Its age detail is limited to totals for ages 16 and over, 20 and over, 16 to 19, and 25 and over. No published BLS table shows the adjustment's effects by detailed age group. The single-year-of-age decomposition in this piece is a Data 4 The People calculation from the two January 2026 microdata files. The supplemental table's 25-and-over row is consistent with that decomposition: the adjustment lowered the participation rate by 0.6 percentage point for ages 25 and over, versus 0.4 for ages 16 and over, reflecting the upward revision to the young population that partially offset the aggregate effect.
Participation rates by age band ("79 of 100," "9 of 100") are D4TP calculations from the June 2026 basic monthly file, not seasonally adjusted. BLS does not publish participation rates for the 30-64 or 75-and-over age bands.
Age detail: the 65-and-over gain of 1,490,650 comprises +272,064 at ages 65-74, +562,416 at ages 75-79, and +656,170 at ages 80 and over. Ages 80-84 and 85+ are topcoded in the public-use files.
One feature of the revision we cannot explain: it changes sharply at exactly age 30. People in their late twenties were revised up (native-born as well as foreign-born), while people in their early thirties were revised down. The Census Bureau's published materials do not explain this boundary, and we cannot from the microdata alone.
The revision reflects the Census Bureau's Vintage 2025 population estimates, which replaced the "blended base" methodology with demographic detail from the 2020 Census via the Modified Age and Race Census (MARC) file, and incorporated updated (lower) estimates of net international migration. The 2026 adjustment was delayed from February to March by the 2025 federal government shutdown. Population controls are estimates, not counts.
The payroll benchmark revision referenced in the body is the annual Current Employment Statistics benchmark to the Quarterly Census of Employment and Wages; the preliminary estimate is scheduled for release August 28, 2026. Payroll benchmark revisions and population control adjustments are separate processes affecting separate surveys.
Support Data That Serves the Public
Data should empower people, not just institutions. Your support helps us create accessible research, visualizations, and tools that uncover economic inequality and inform better decisions.
Donate
Enjoying this post?
Tell others about it.
More articles like this
Fetching Related Posts
There are no other articles tagged with Data 4 Thought